2023 · Paper 1 · Question 9 · Ordinary Level
Disease models
Graphs · Percentage error · Exponential growth · Standard form
Mixed topics · The selected topic applies to some parts of this whole question.
Open in original paper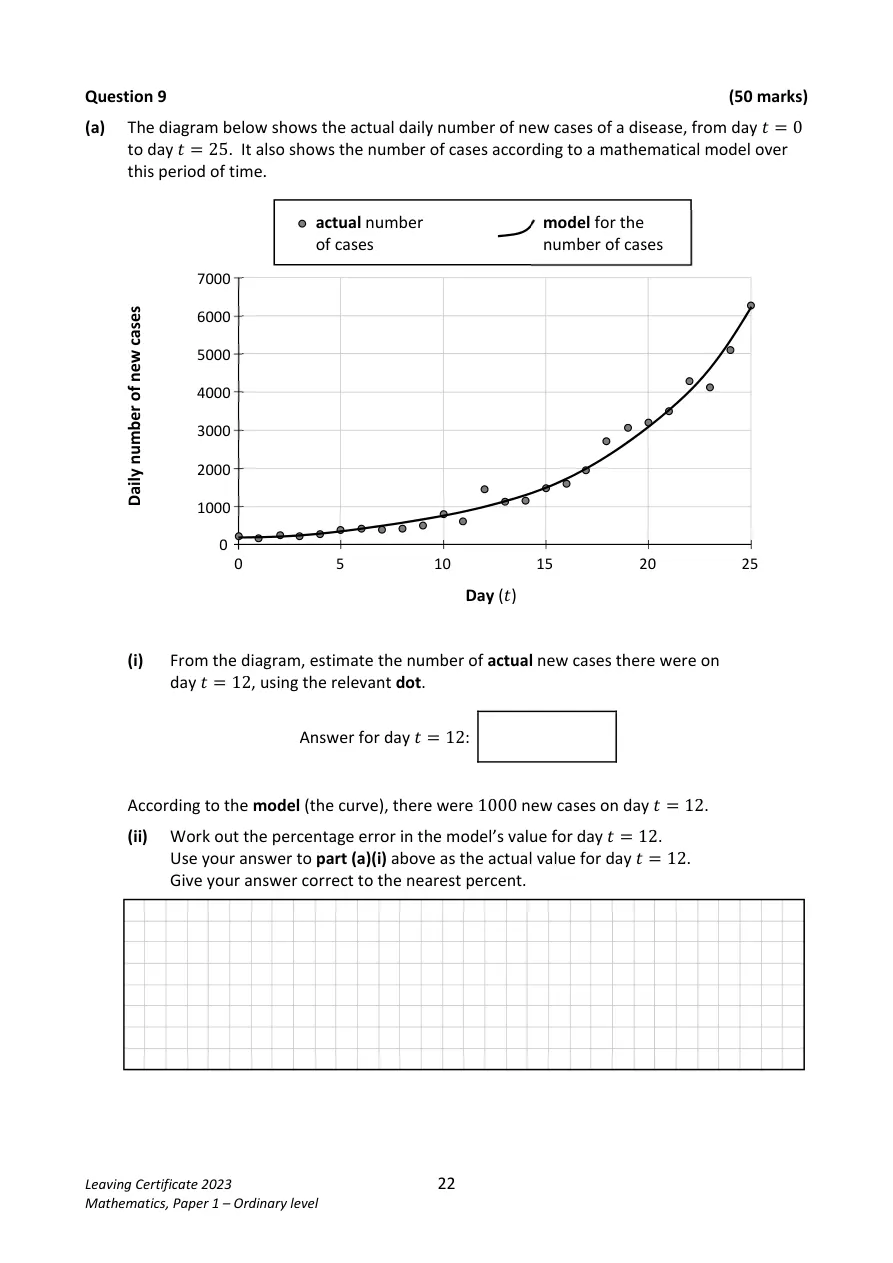
Show solutions
Follow the working below. The original question is unchanged.
a) Graph estimates
- A(12)\approx1500
- \mathrm{error}=\dfrac{1500-1000}{1500}\times100
- \mathrm{error}\approx33\%
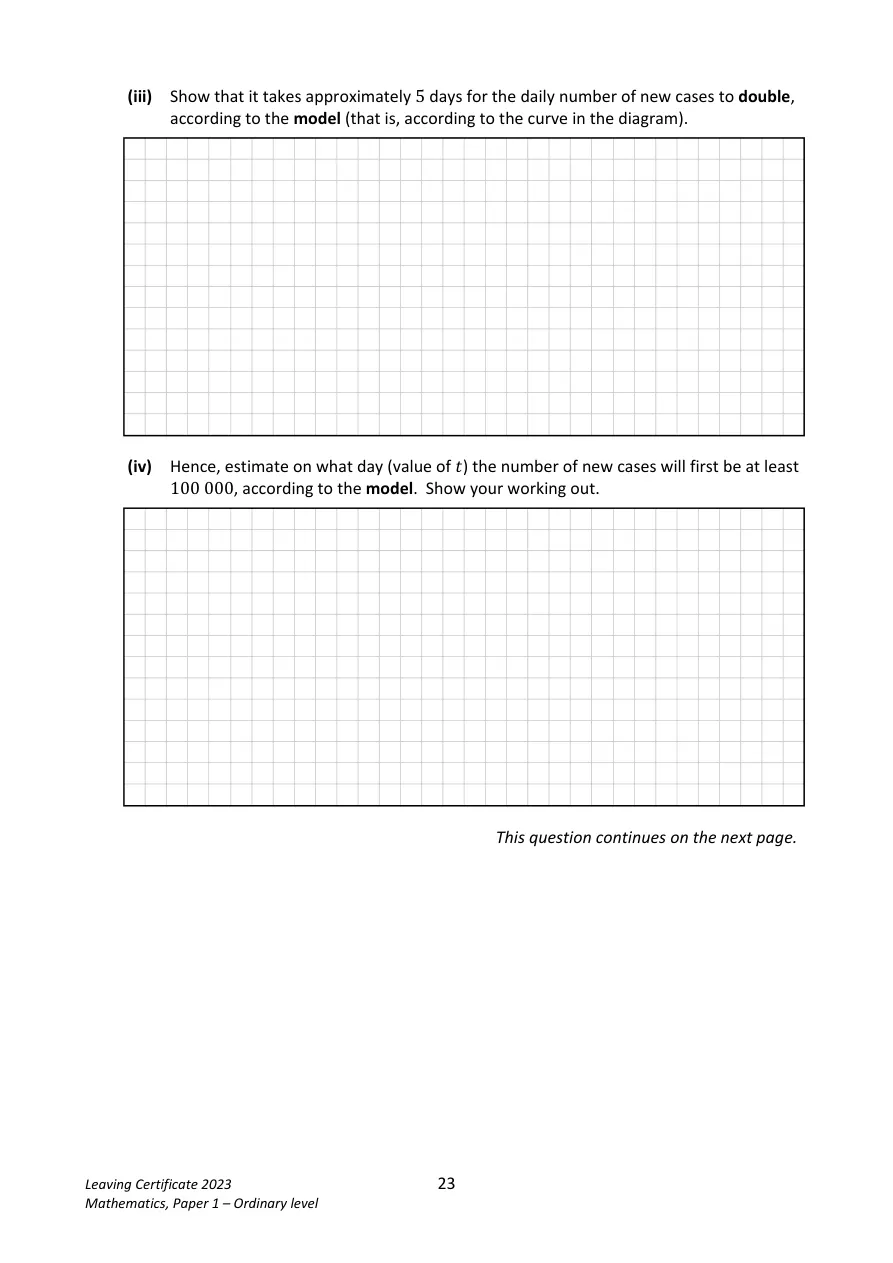
- The model gives about 1500 on day 15 and 3000 on day 20: doubling takes about 5 days. Continuing: day 25 → 6000; 30 → 12000; 35 → 24000; 40 → 48000; 45 → 96000. It first reaches about 100000 on day 46. This is an estimate from the model graph.
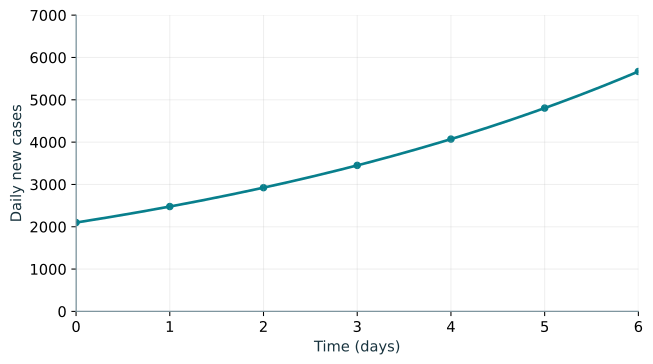
b) Function D
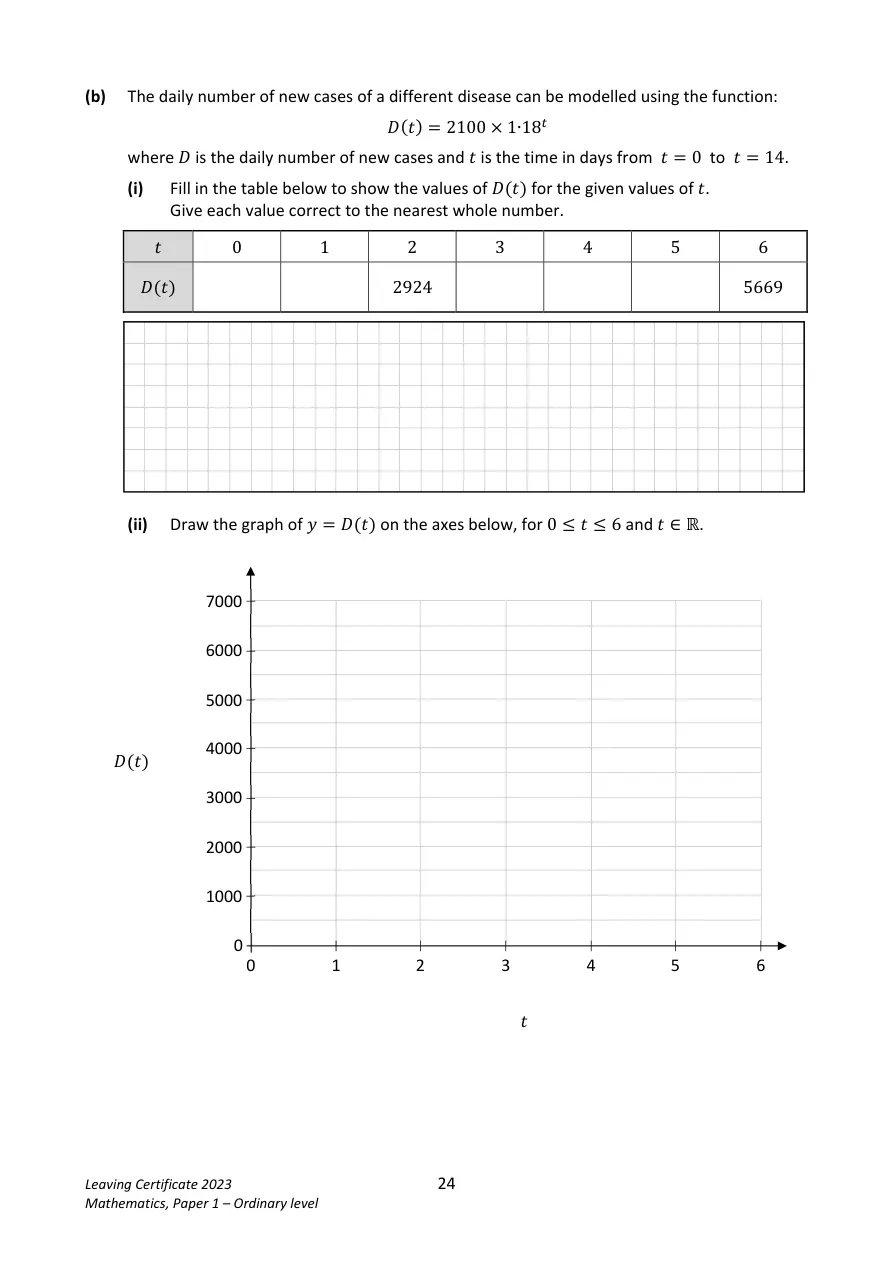
- D(0)=2100,\quad D(1)=2478,\quad D(2)=2924
- D(3)=3450,\quad D(4)=4071
- D(5)=4804,\quad D(6)=5669
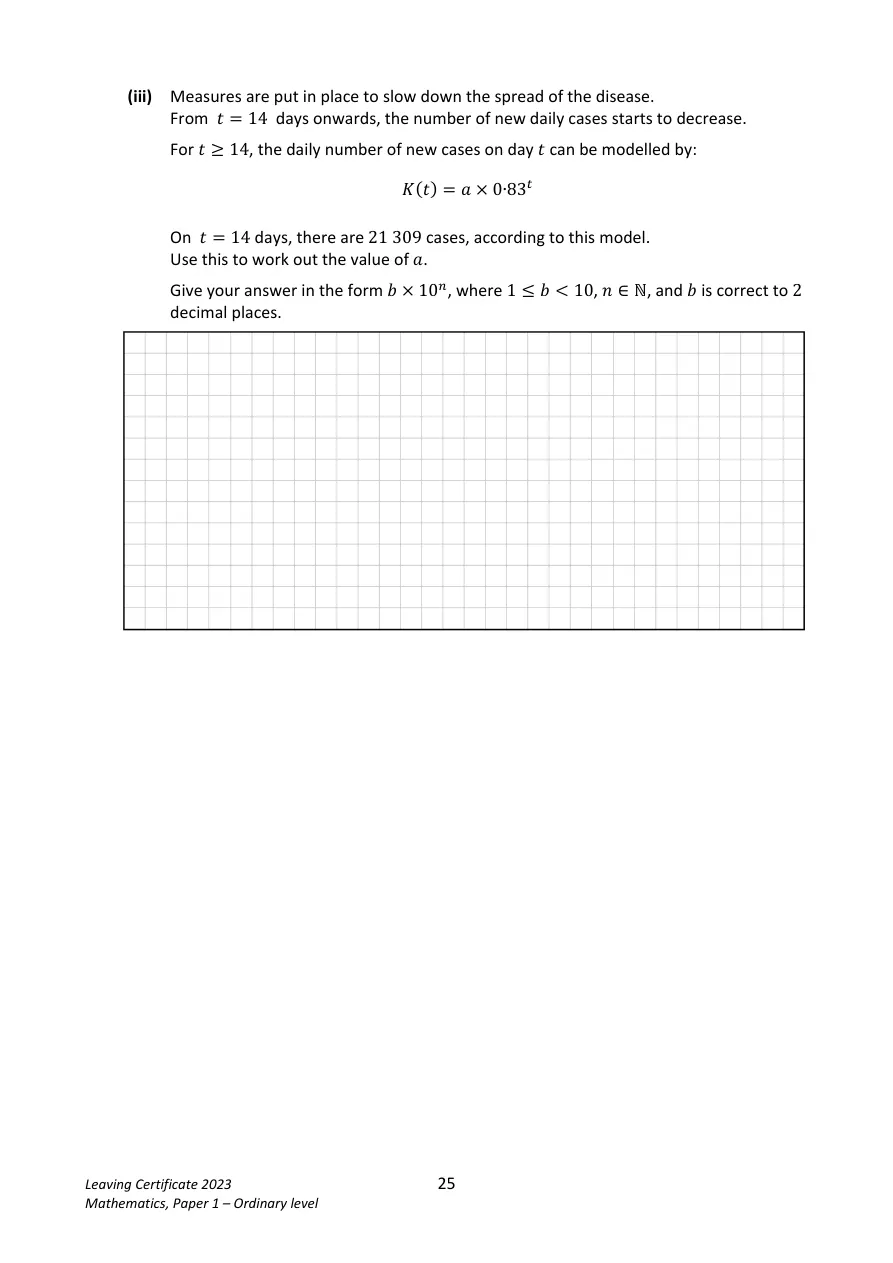
- 21309=a(0.83)^{14}
- a=\dfrac{21309}{0.83^{14}}
- a\approx2.89\times10^5
See working and diagrams on the original paper
A(12)\approx1500
\mathrm{error}=\dfrac{1500-1000}{1500}\times100
\mathrm{error}\approx33\%
The model gives approximately 1500 cases on day 15 and 3000 on day 20. The daily
cases double in about 5 days.
Day 25: 6000
Day 30: 12000
Day 35: 24000
Day 40: 48000
Day 45: 96000
About day 46: at least 100000.
21309=a(0.83)^{14}
a=\dfrac{21309}{0.83^{14}}
a\approx2.89\times10^5
Teacher sign-in and homework controls
Use your existing homework account. Questions and solutions are open to everyone.
Join a class or open your homework →