2026 · Question 11 · Section B
Hydrogen peroxide reaction
Rates of reaction · Chemical reactions · Energy in reactions · Graphs · Investigations
Mixed topics: some parts assess other topics. The whole question is preserved.
Open in original paper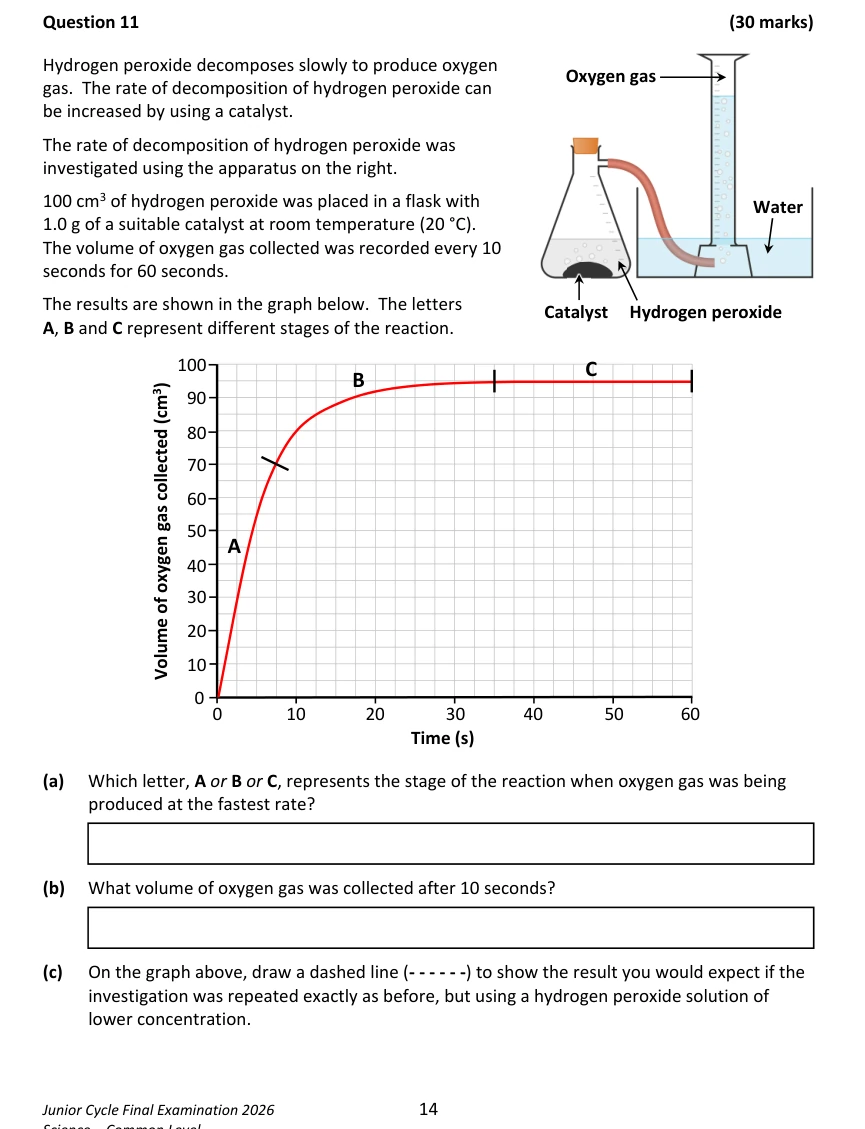
Show solutions
2026 · Question 11 · Worked solution
Answers are placed on the original paper, with diagram labels and blue teaching notes alongside. Teacher-completed model based on the SEC marking scheme. Added explanations are teaching notes; no answer mark allocations have been added.
Text version and further explanations
Teacher solution based on the SEC 2026 marking scheme with added explanations. Teaching guidance, not an official SEC worked answer.
Working and answers are in dark text. Blue “Why this works” notes explain the key ideas beside the relevant step. On a phone, the note appears directly underneath.
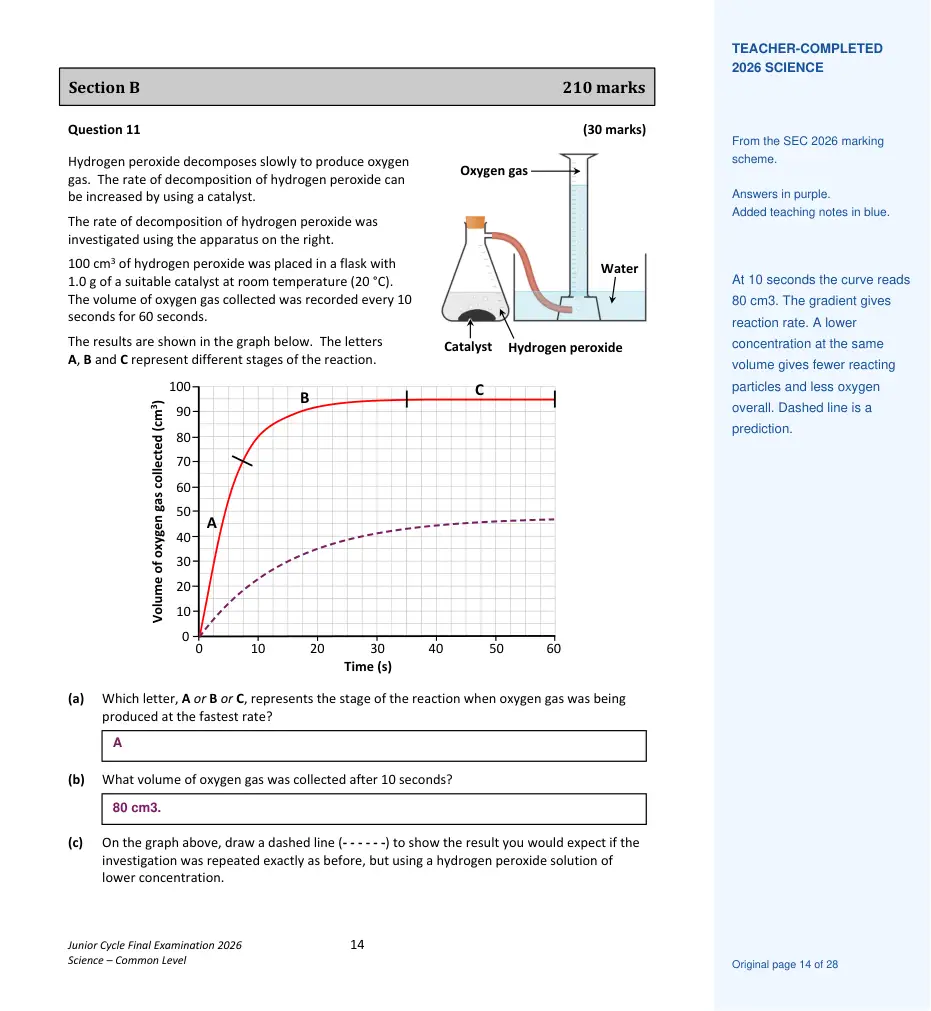
a) A: greatest gradient, hence fastest oxygen production.
b) 80 cm³ at 10 s.
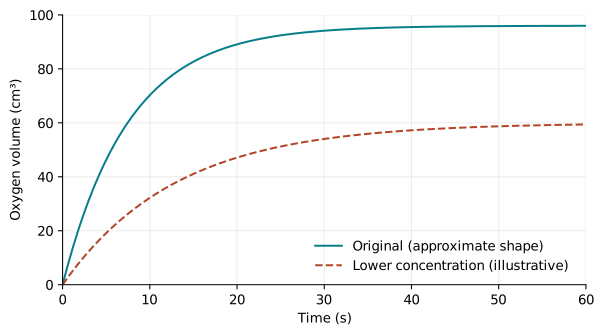
c) With the same solution volume but lower concentration, sketch a shallower curve reaching a lower final oxygen volume. There is less hydrogen peroxide available. See illustrative comparison graph.
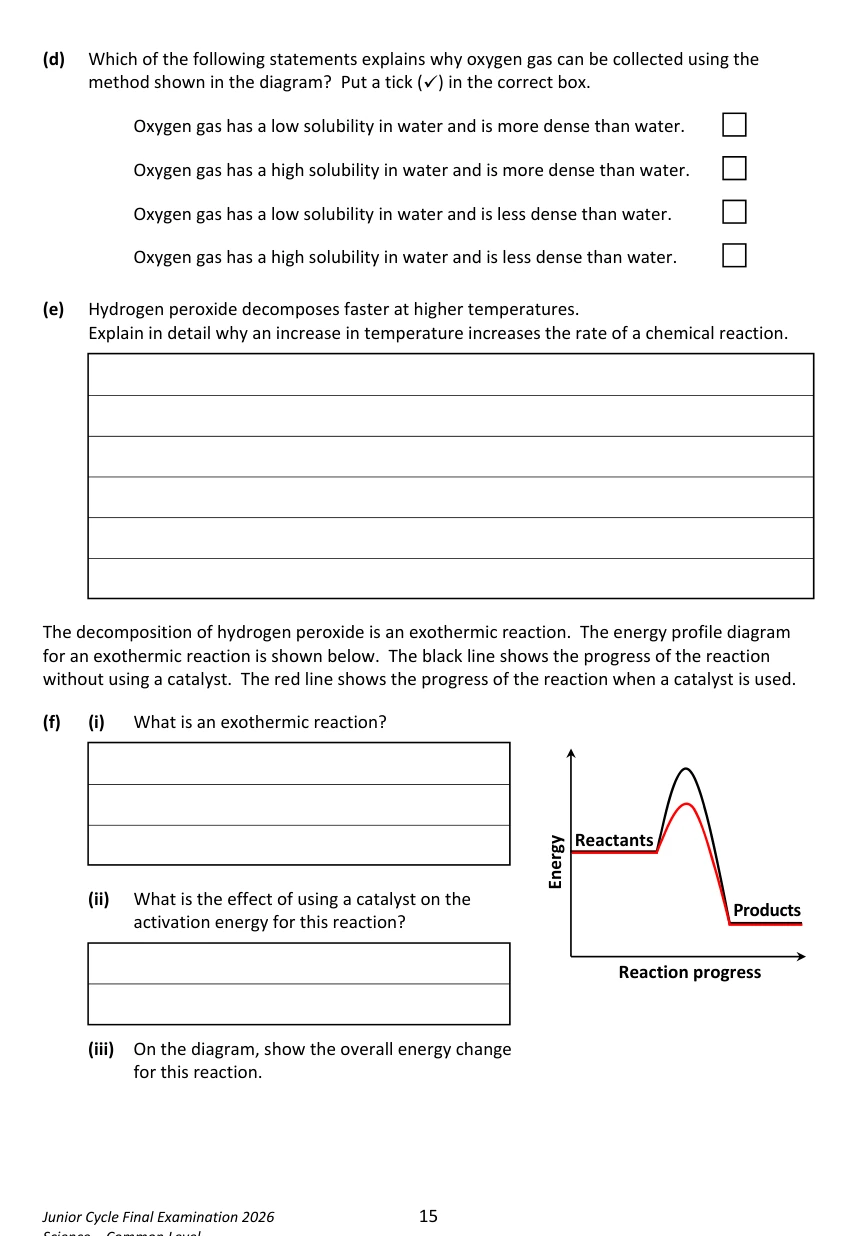
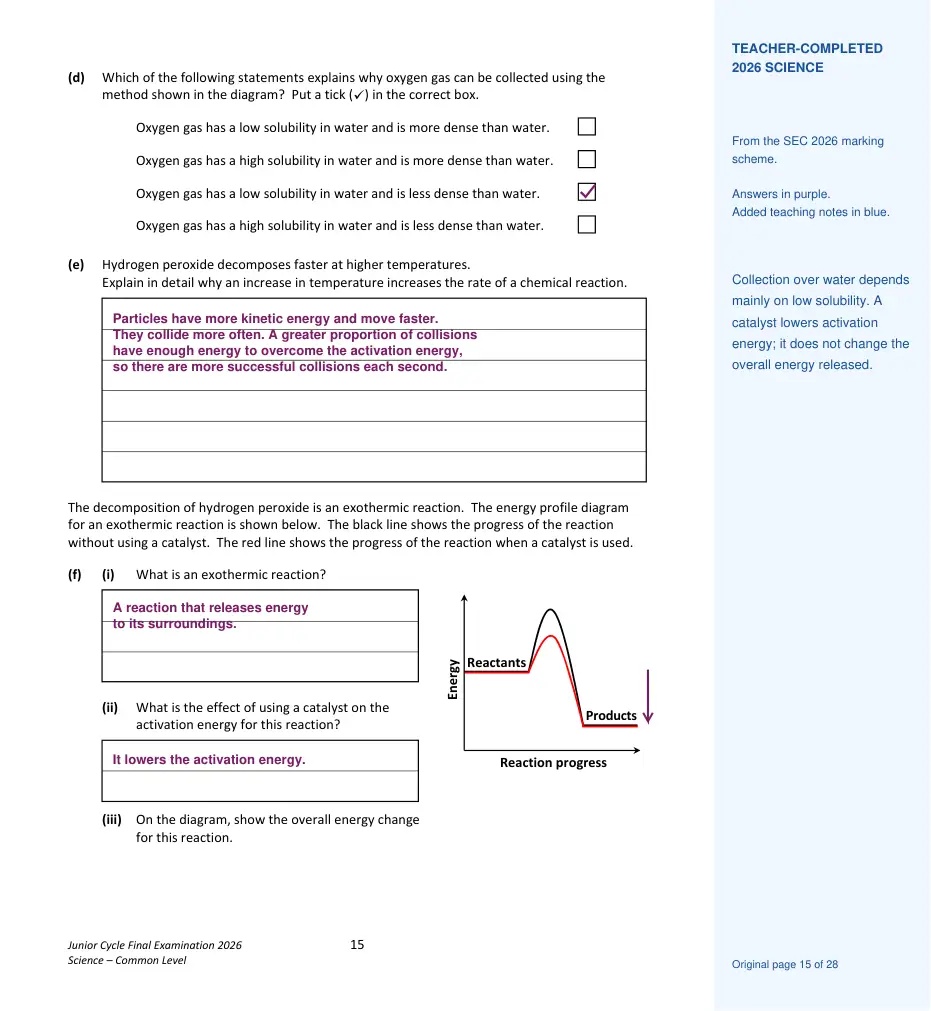
d) Low solubility in water and less dense than water. Its low solubility is the key reason it can be collected over water.
e) Higher temperature gives particles more kinetic energy. They collide more frequently and a greater fraction of collisions have enough energy to overcome activation energy, increasing reaction rate.
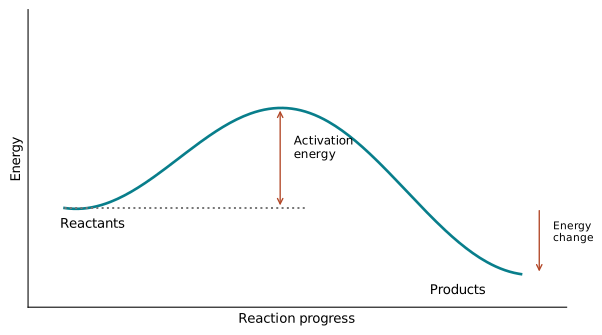
f) i) Exothermic means energy is released to the surroundings. ii) A catalyst lowers activation energy. iii) Draw a vertical downward arrow from reactant to product energy levels; see diagram.
Teacher sign-in and homework controls
Questions and worked solutions are open to everyone. Teachers can sign in to assign homework.
Join a class or manage your homework →