2026 · Question 15 · Section B
Speed–time graphs
Motion · Graphs · Measurement
Mixed topics: some parts assess other topics. The whole question is preserved.
Open in original paper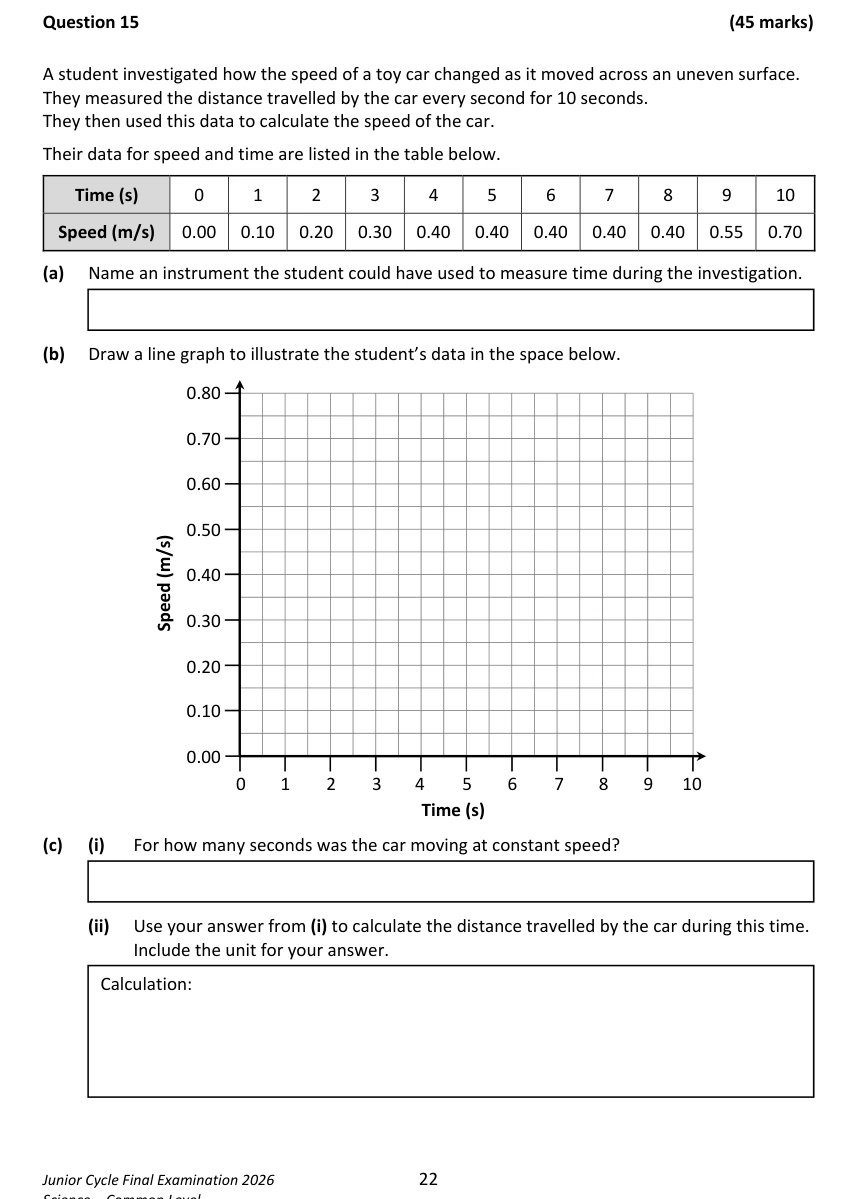
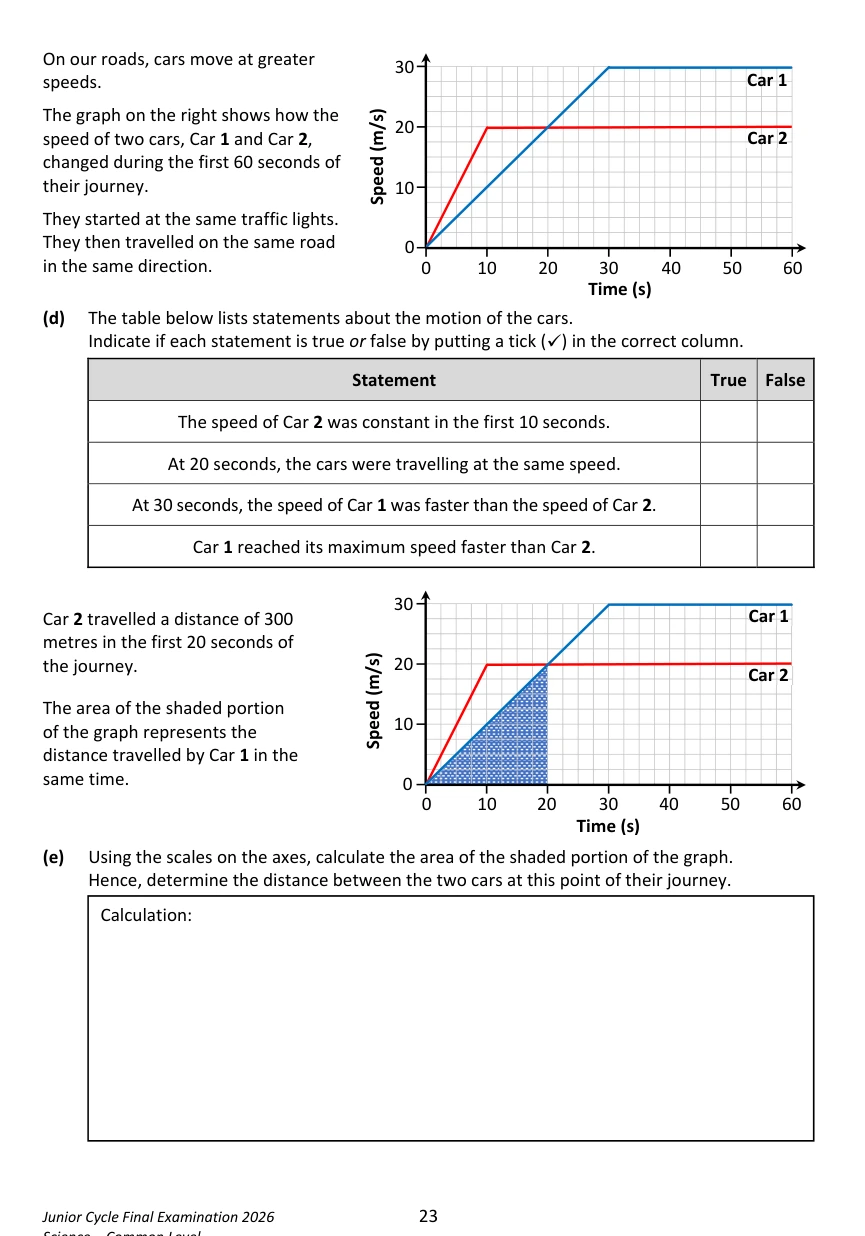
Show solutions
2026 · Question 15 · Worked solution
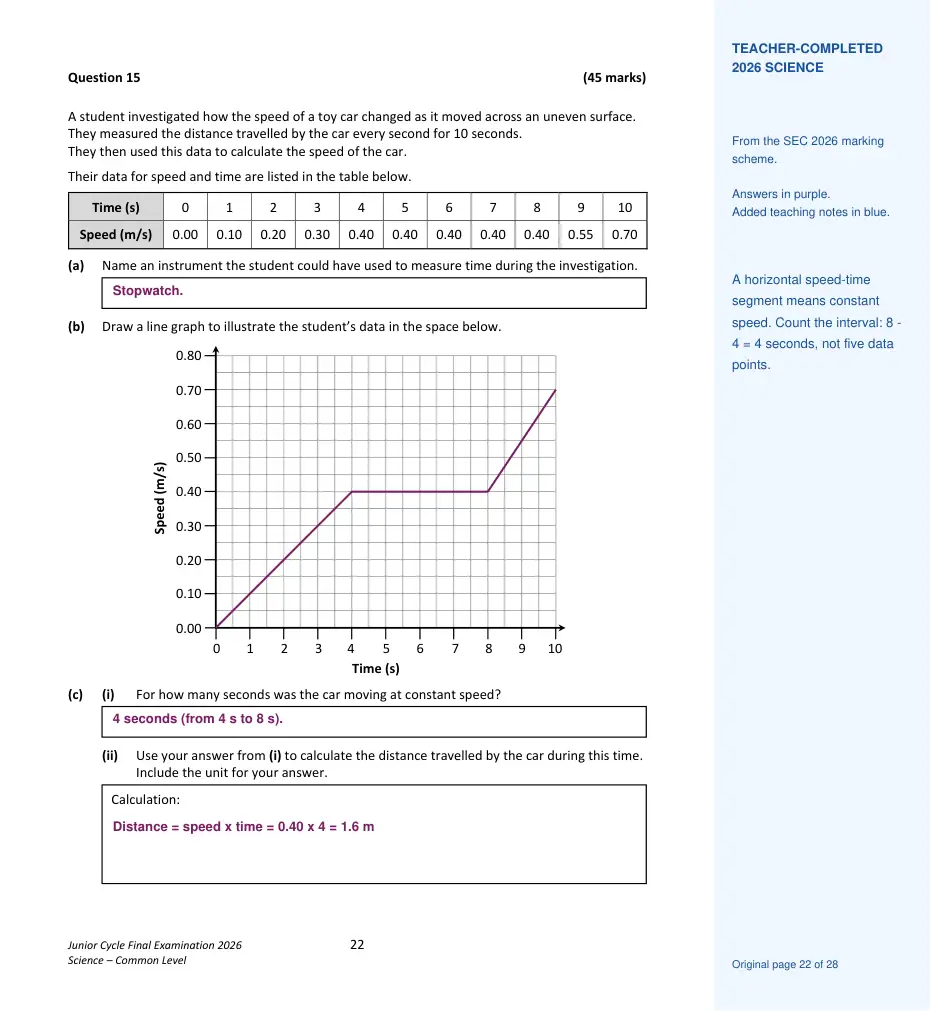
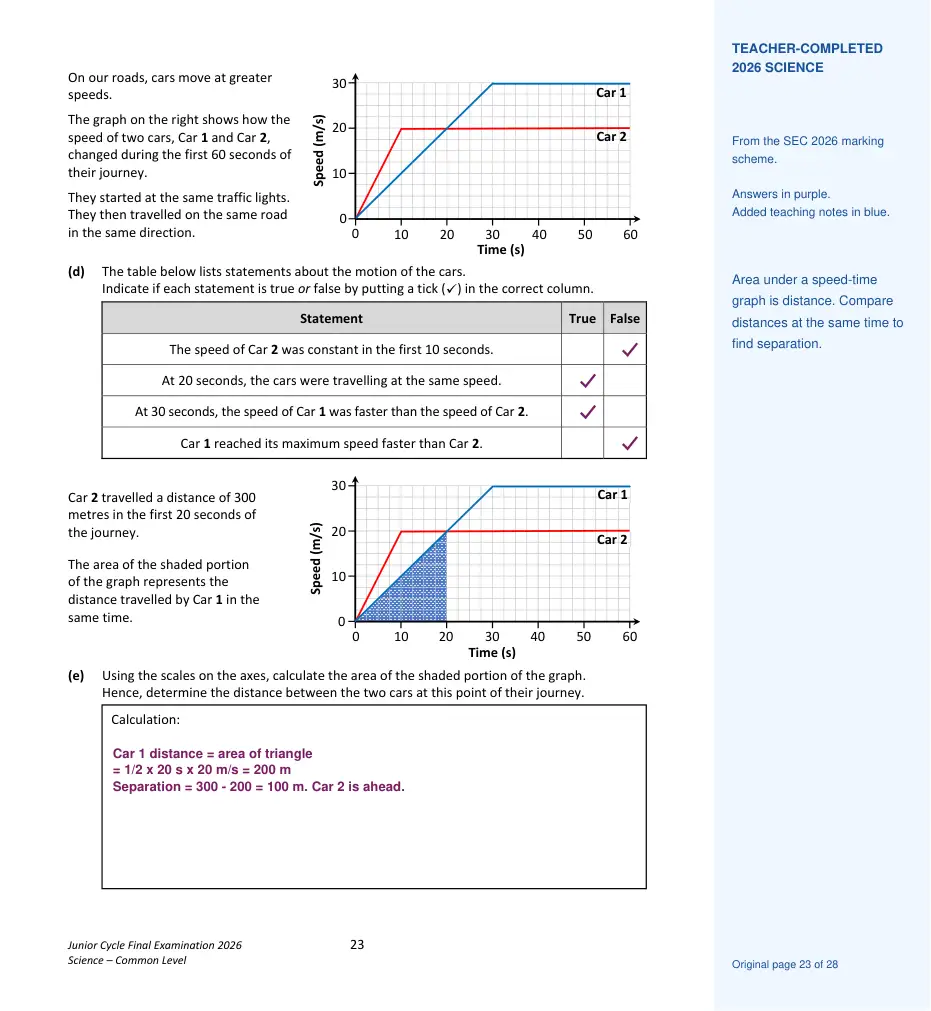
Answers are placed on the original paper, with diagram labels and blue teaching notes alongside. Teacher-completed model based on the SEC marking scheme. Added explanations are teaching notes; no answer mark allocations have been added.
Text version and further explanations
Teacher solution based on the SEC 2026 marking scheme with added explanations. Teaching guidance, not an official SEC worked answer.
Working and answers are in dark text. Blue “Why this works” notes explain the key ideas beside the relevant step. On a phone, the note appears directly underneath.
a) Stopwatch.
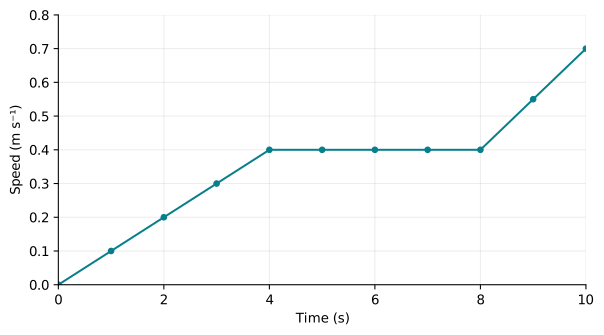
b) Plot and join all eleven data points as shown in the solution graph.
c) i) 4 s, from t = 4 s to t = 8 s. ii) Distance = speed × time = 0.40 × 4 = 1.6 m. Count the interval length, not the number of table entries.
d) In order: false; true; true; false.
e) Car 1's distance = triangular area = ½ × 20 × 20 = 200 m. Car 2 travels 300 m, so separation = 300 − 200 = 100 m. Both start together and move in the same direction.
Teacher sign-in and homework controls
Questions and worked solutions are open to everyone. Teachers can sign in to assign homework.
Join a class or manage your homework →