2023 · Paper 2 · Question 9 · Ordinary Level
Reading survey and test results
Grouped data · Median · Histograms · Sampling · Margin of error · Hypothesis tests
Mixed topics · The selected topic applies to some parts of this whole question.
Open in original paper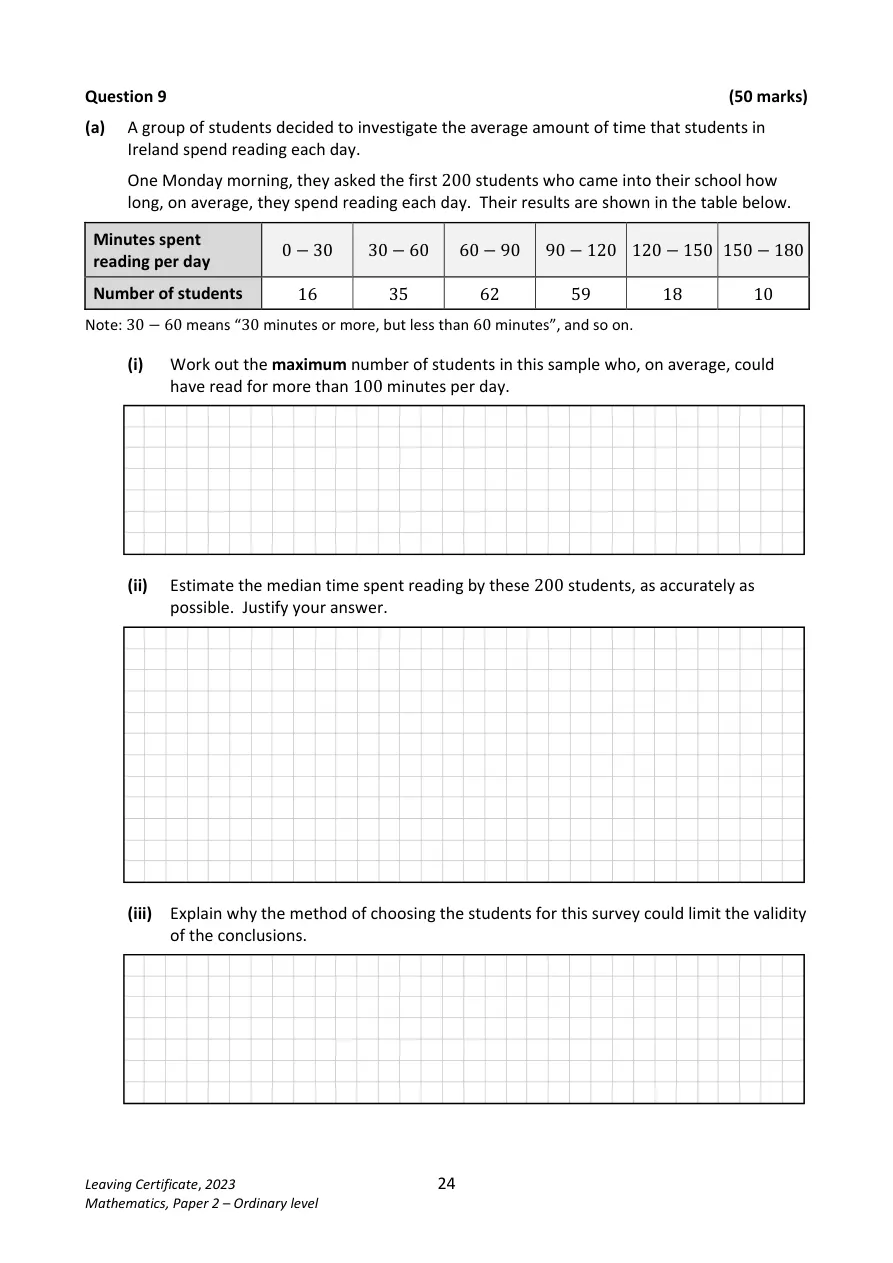
Show solutions
Follow the working below. The original question is unchanged.
a) Reading survey
- N_{\max}=59+18+10=87
- The 100th and 101st values fall in the 60–90 minute class: cumulative frequencies are 16, 51, 113, 172, 190, 200. An estimate of 75 minutes (the class midpoint) is reasonable; the exact median is unknown from grouped data.
- The first 200 arrivals at one school may not represent all students in Ireland. Arrival patterns and the choice of just one school can bias the sample.
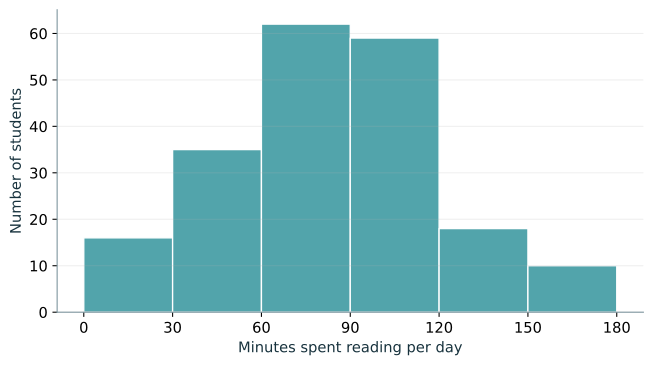
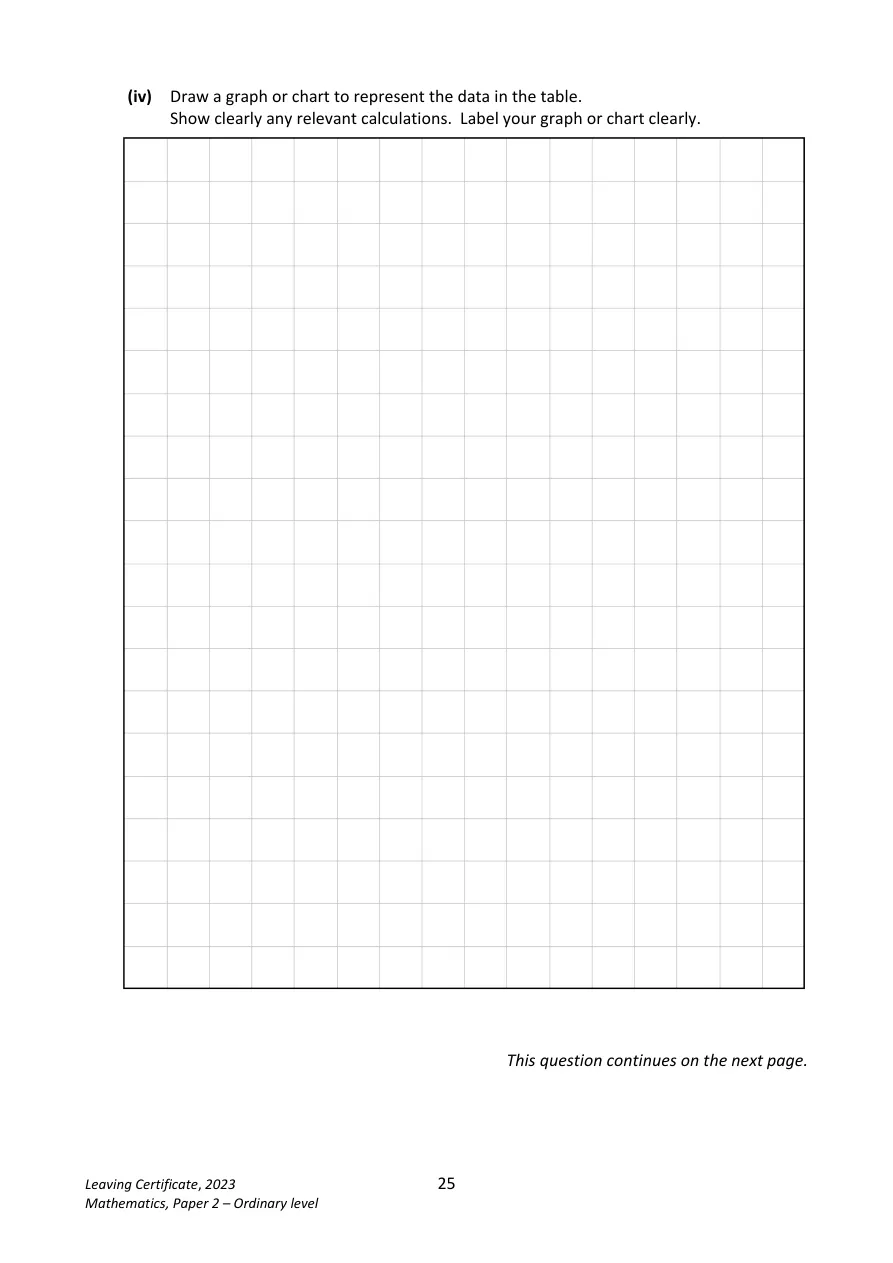
- All classes have equal width, so the histogram heights can be their frequencies: 16, 35, 62, 59, 18, 10.
b) Test results
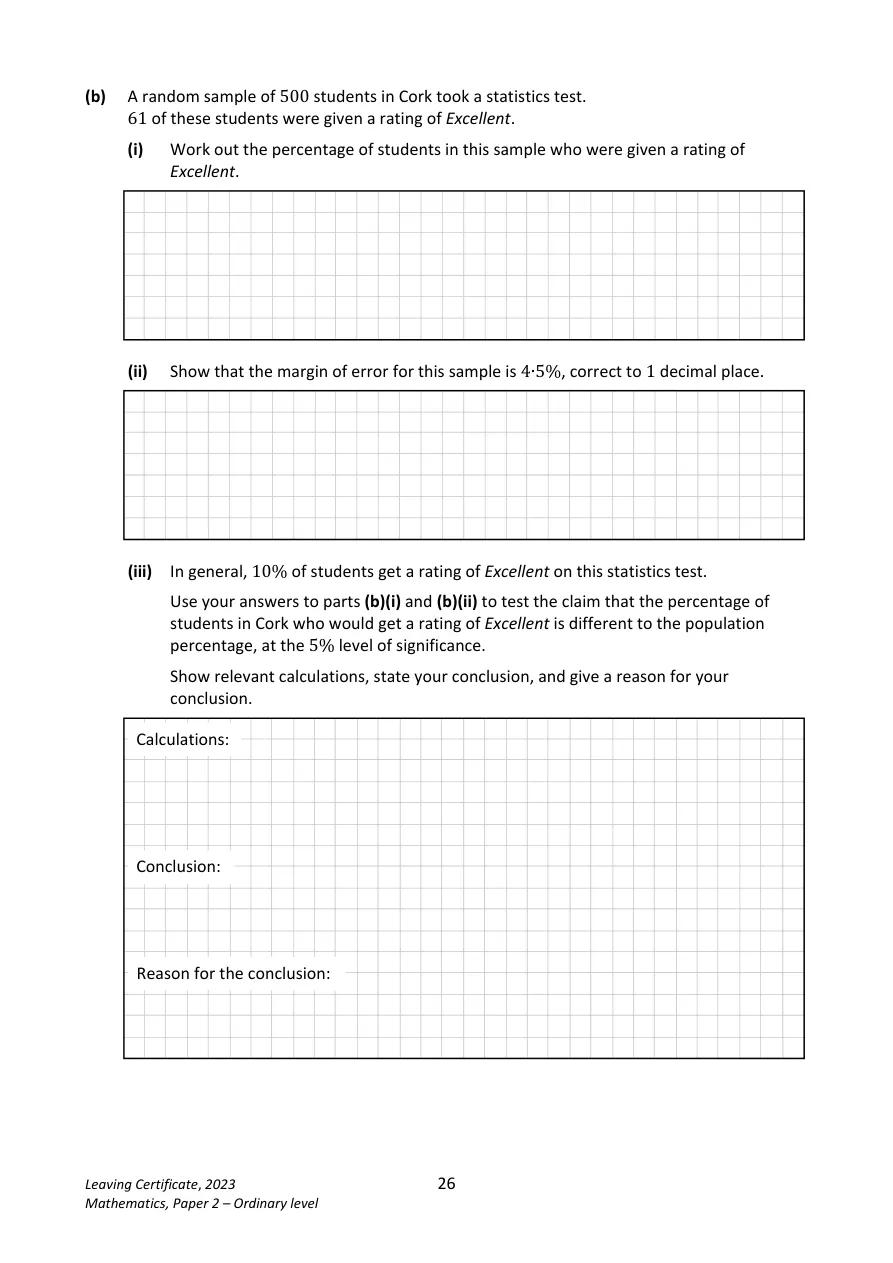
- \hat p=\dfrac{61}{500}\times100=12.2\%
- E=\dfrac{1}{\sqrt{500}}\times100\%
- E\approx4.5\%
- \mathrm{CI}=[12.2-4.5,12.2+4.5]\%
- \mathrm{CI}=[7.7,16.7]\%
- 10% lies inside the interval. There is insufficient evidence at the 5% significance level that the Cork population proportion differs from 10%.
See working and diagrams on the original paper
N_{\max}=59+18+10=87
The 100th and 101st values fall in the 60–90 minute class: cumulative frequencies are
16, 51, 113, 172, 190, 200. An estimate of 75 minutes (the class midpoint) is
reasonable; the exact median is unknown from grouped data.
The first 200 arrivals at one school may not represent all students in Ireland. Arrival
patterns and the choice of just one school can bias the sample.
All classes have equal width, so the histogram heights can be their frequencies: 16,
35, 62, 59, 18, 10.
\hat p=\dfrac{61}{500}\times100=12.2\%
E=\dfrac{1}{\sqrt{500}}\times100\%
E\approx4.5\%
\mathrm{CI}=[12.2-4.5,12.2+4.5]\%
\mathrm{CI}=[7.7,16.7]\%
Insufficient evidence of a difference from 10%.
10% lies inside the 95% confidence interval [7.7%, 16.7%].
Teacher sign-in and homework controls
Use your existing homework account. Questions and solutions are open to everyone.
Join a class or open your homework →