2024 · Paper 2 · Question 7 · Ordinary Level
Fitness and park runs
Stem and leaf plots · Statistics · Correlation · Margin of error · Hypothesis tests
Mixed topics · The selected topic applies to some parts of this whole question.
Open in original paper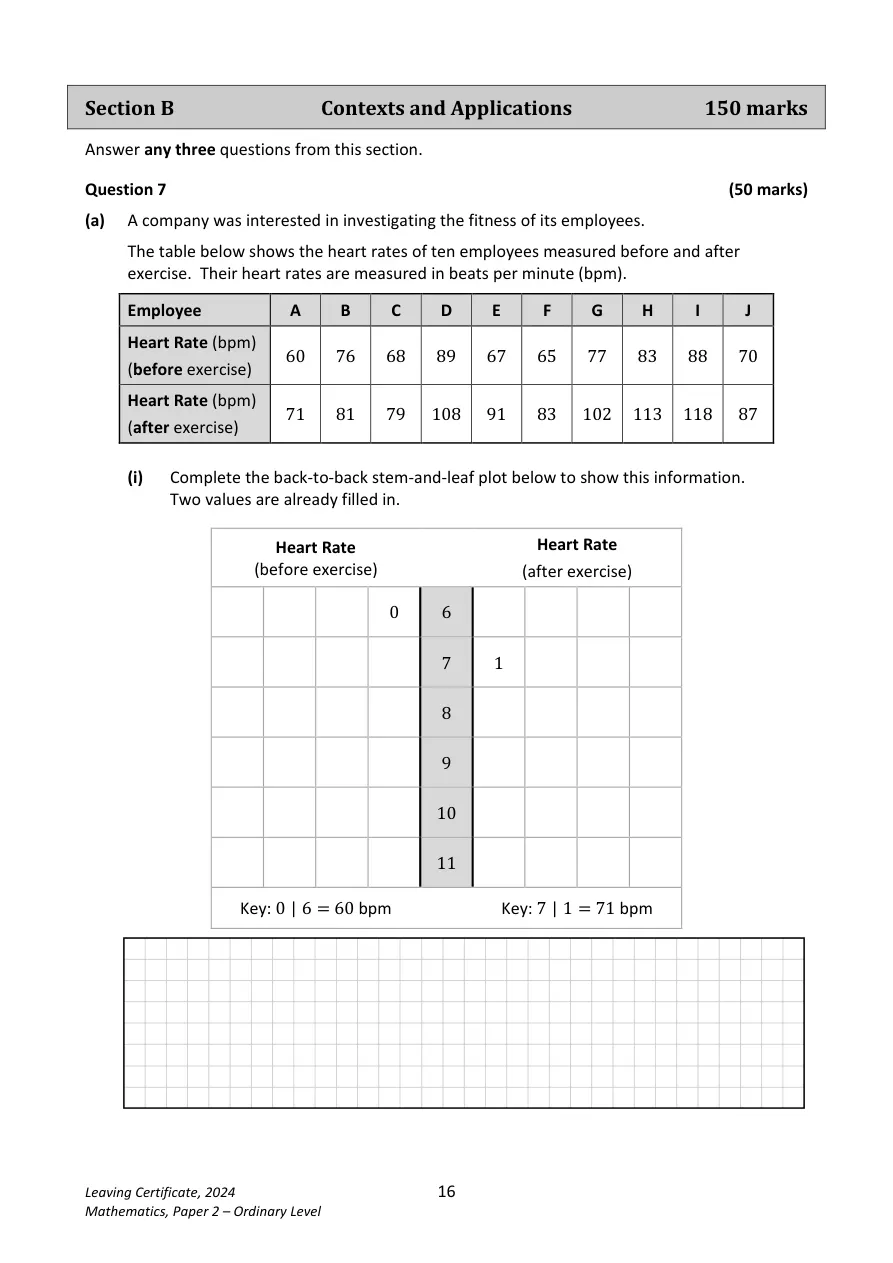
Show solutions
Follow the working below. The original question is unchanged.
a) Heart rates
- Back-to-back plot, stems 6, 7, 8, 9, 10, 11. Before-exercise leaves in descending order: 8 7 5 0 | 6; 7 6 0 | 7; 9 8 3 | 8; no leaves for 9–11. After-exercise leaves ascending: 7 | 1 9; 8 | 1 3 7; 9 | 1; 10 | 2 8; 11 | 3 8. Key: 6 | 0 = 60 bpm on the left; 7 | 1 = 71 bpm on the right.
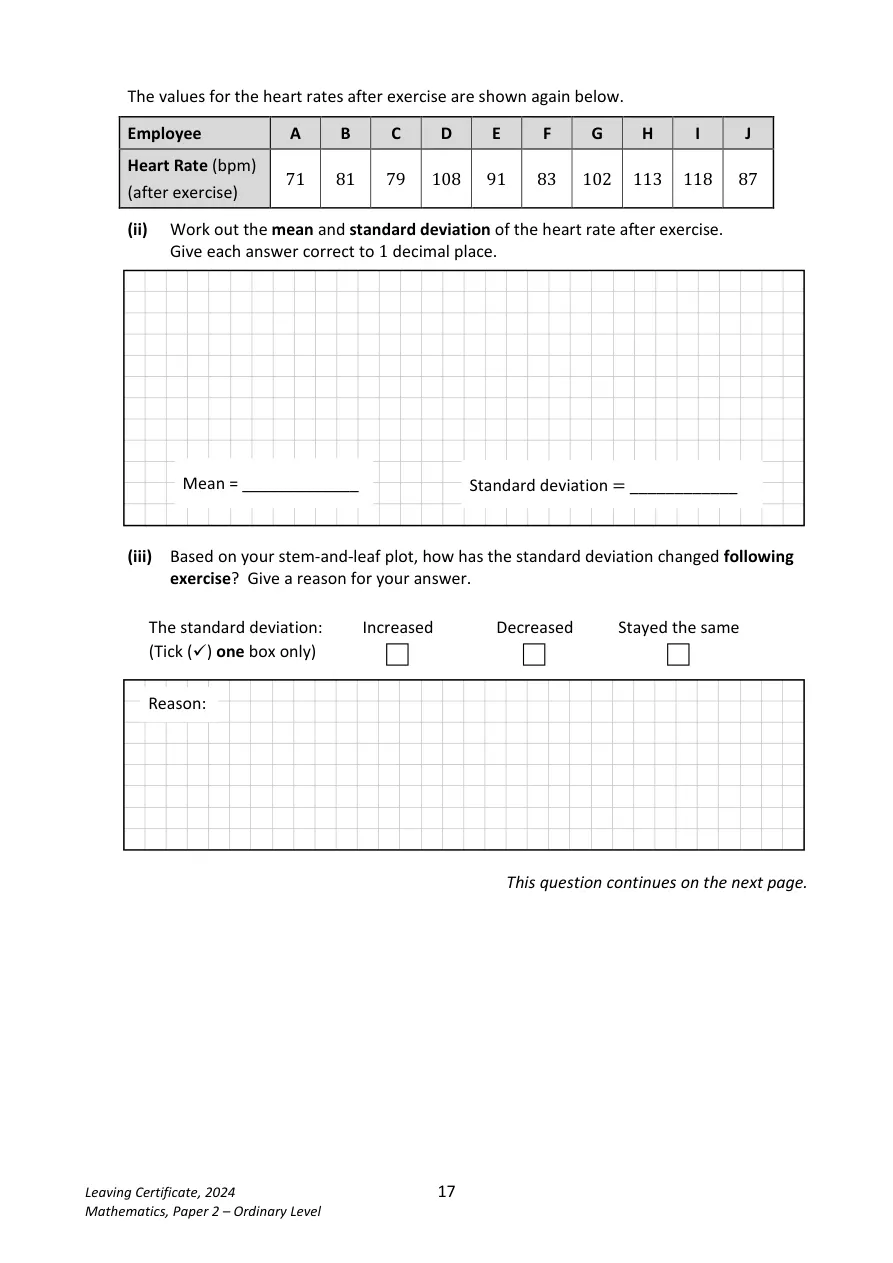
- \mu=\dfrac{933}{10}=93.3\ \mathrm{bpm}
- \sigma=\sqrt{\dfrac{\sum(x-93.3)^2}{10}}
- \sigma\approx15.1\ \mathrm{bpm}
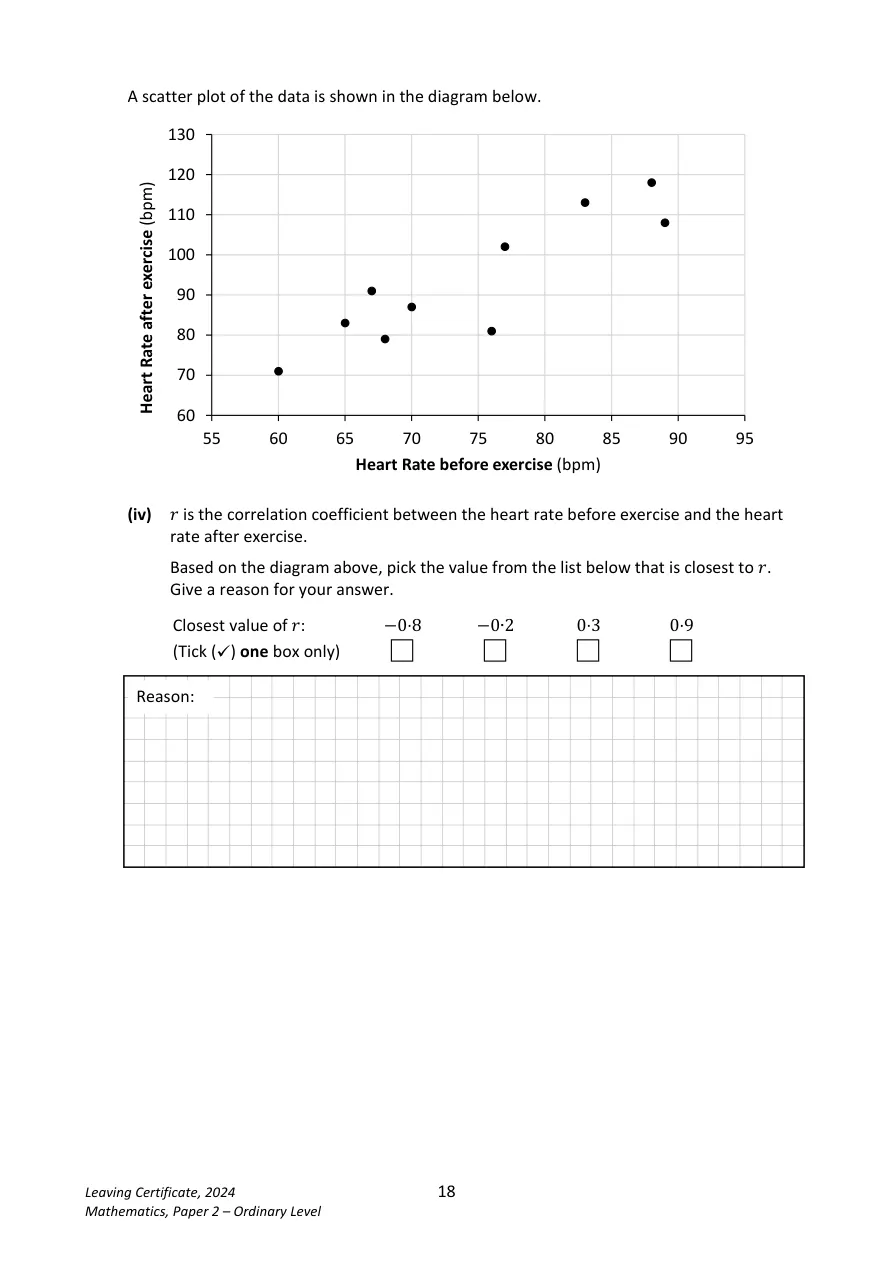
- The standard deviation increased: heart rates are more spread out after exercise. Choose r = 0.9; the scatter plot has strong positive correlation.
b) Inference
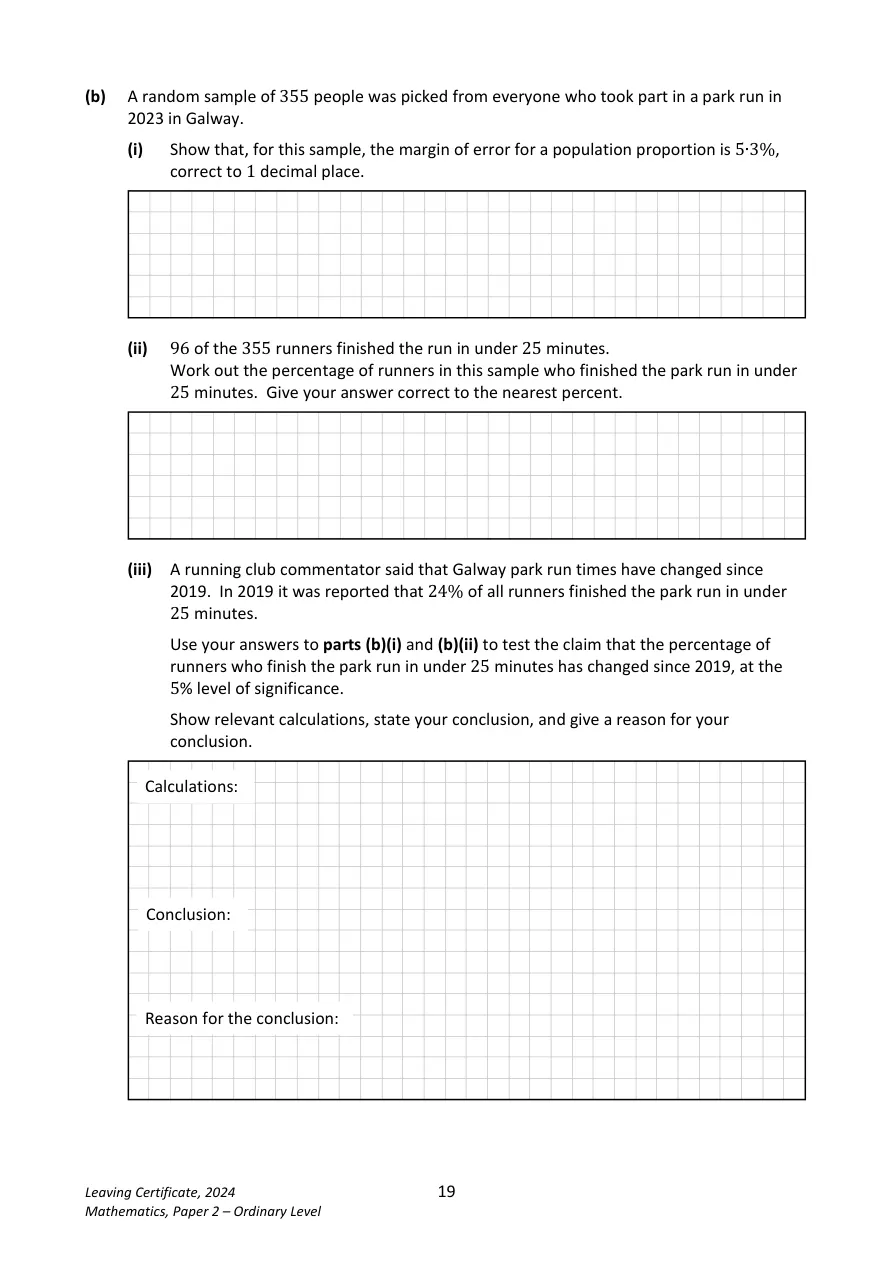
- E=\dfrac{1}{\sqrt{355}}\times100\%
- E\approx5.3\%
- \hat p=\dfrac{96}{355}\times100\%
- \hat p\approx27\%
- \mathrm{CI}=[27-5.3,27+5.3]\%
- \mathrm{CI}=[21.7,32.3]\%
- 24% lies in the interval, so there is insufficient evidence at the 5% significance level that the population proportion has changed.
See working and diagrams on the original paper
\mu=\dfrac{933}{10}=93.3\ \mathrm{bpm}
\sigma=\sqrt{\dfrac{\sum(x-93.3)^2}{10}}
\sigma\approx15.1\ \mathrm{bpm}
Increased: after exercise, the heart rates are more spread out.
r = 0.9: the scatter plot shows strong positive correlation.
E=\dfrac{1}{\sqrt{355}}\times100\%
E\approx5.3\%
\hat p=\dfrac{96}{355}\times100\%
\hat p\approx27\%
\mathrm{CI}=[27-5.3,27+5.3]\%
\mathrm{CI}=[21.7,32.3]\%
Insufficient evidence that the proportion has changed.
24% lies inside the 95% interval [21.7%, 32.3%].
Teacher sign-in and homework controls
Use your existing homework account. Questions and solutions are open to everyone.
Join a class or open your homework →