2025 · Paper 1 · Question 7 · Ordinary Level
Share prices and models
Graphs · Percentages · Exponential functions · Linear functions
Mixed topics · The selected topic applies to some parts of this whole question.
Open in original paper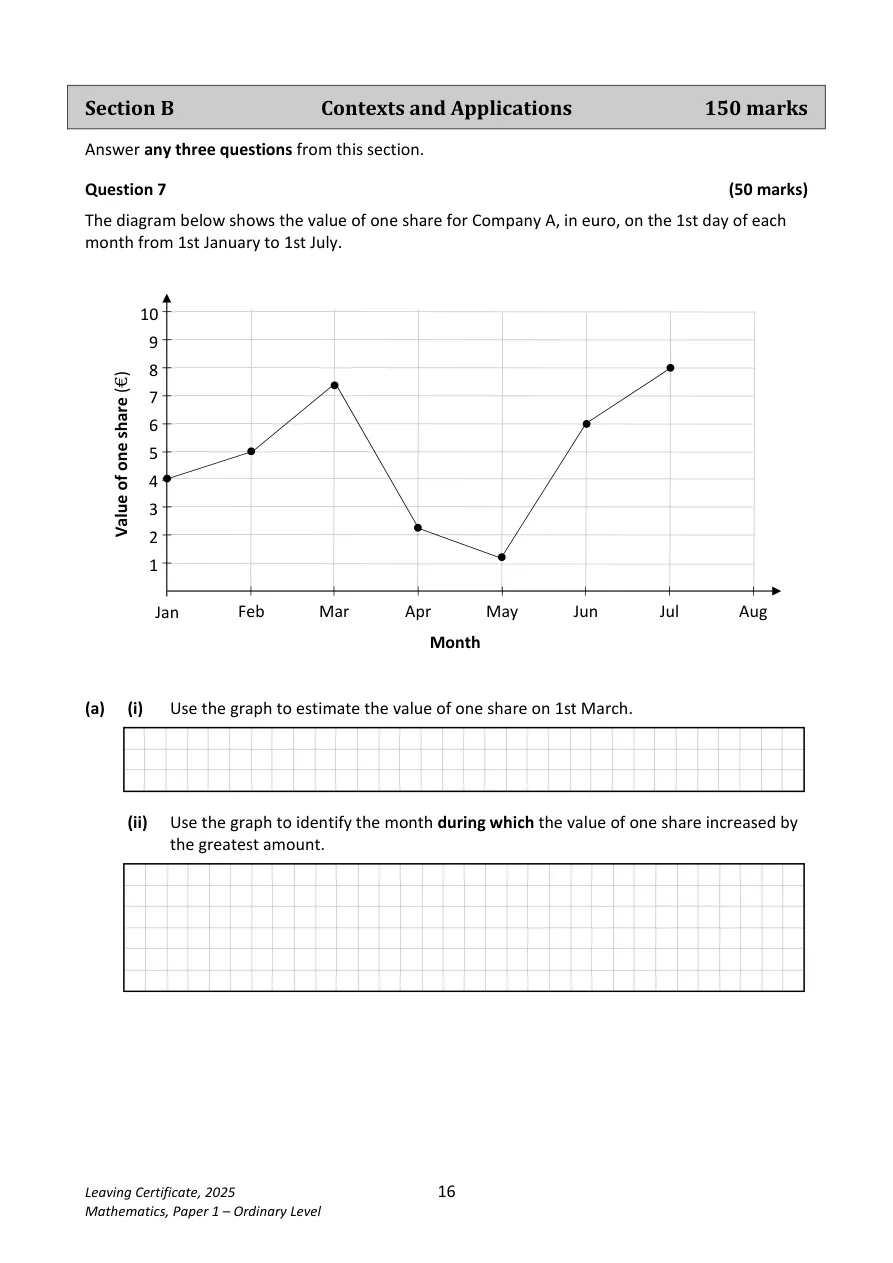
Show solutions
Follow the working below. The original question is unchanged.
a) Read the graph
- (i) Approximately €7.30 on 1 March. (ii) May has the largest increase during the month (from 1 May to 1 June).
b) August value
- A=8(0.85)
- A=\mathrm{€}6.80
- Plot the August point at height 6.8 on the original graph.
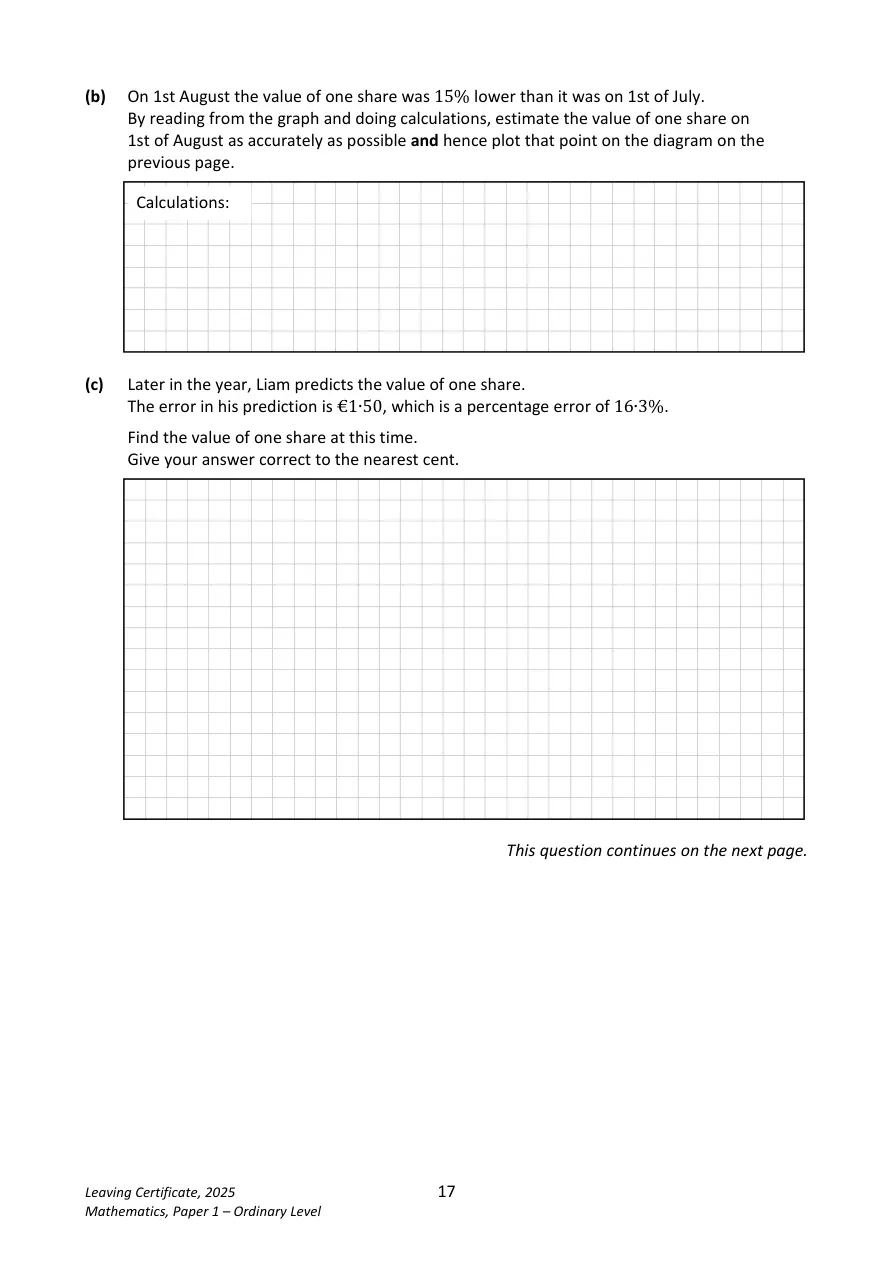
c) Percentage error
- \mathrm{Actual}=\dfrac{1.50}{0.163}
- \mathrm{Actual}\approx\mathrm{€}9.20
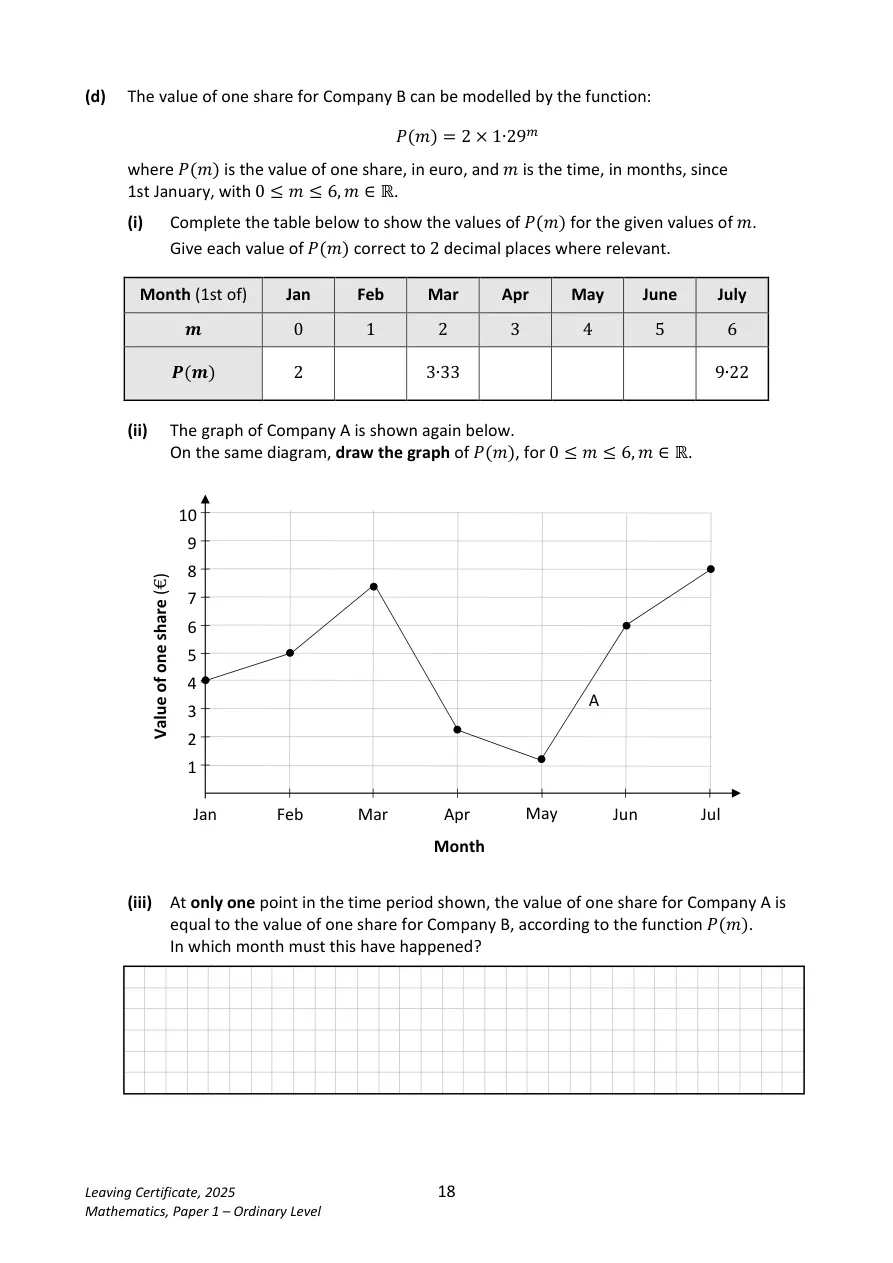
d)(i) Table
- P(m)=2(1.29)^m
- For m = 0,1,2,3,4,5,6: P = 2.00, 2.58, 3.33, 4.29, 5.54, 7.14, 9.22.
d)(ii) Graph
- Plot the table values and join with a smooth increasing curve on the same axes as Company A.
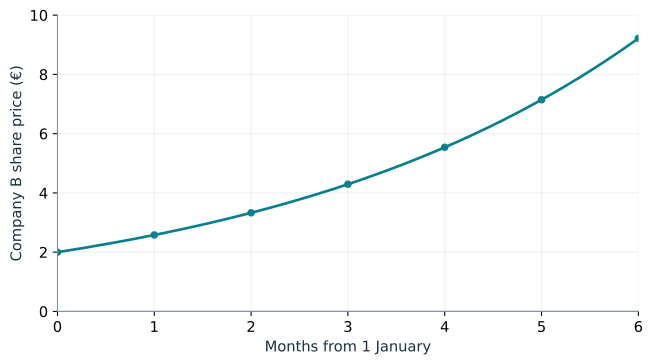
d)(iii) Equal share values
- The curves cross during March.
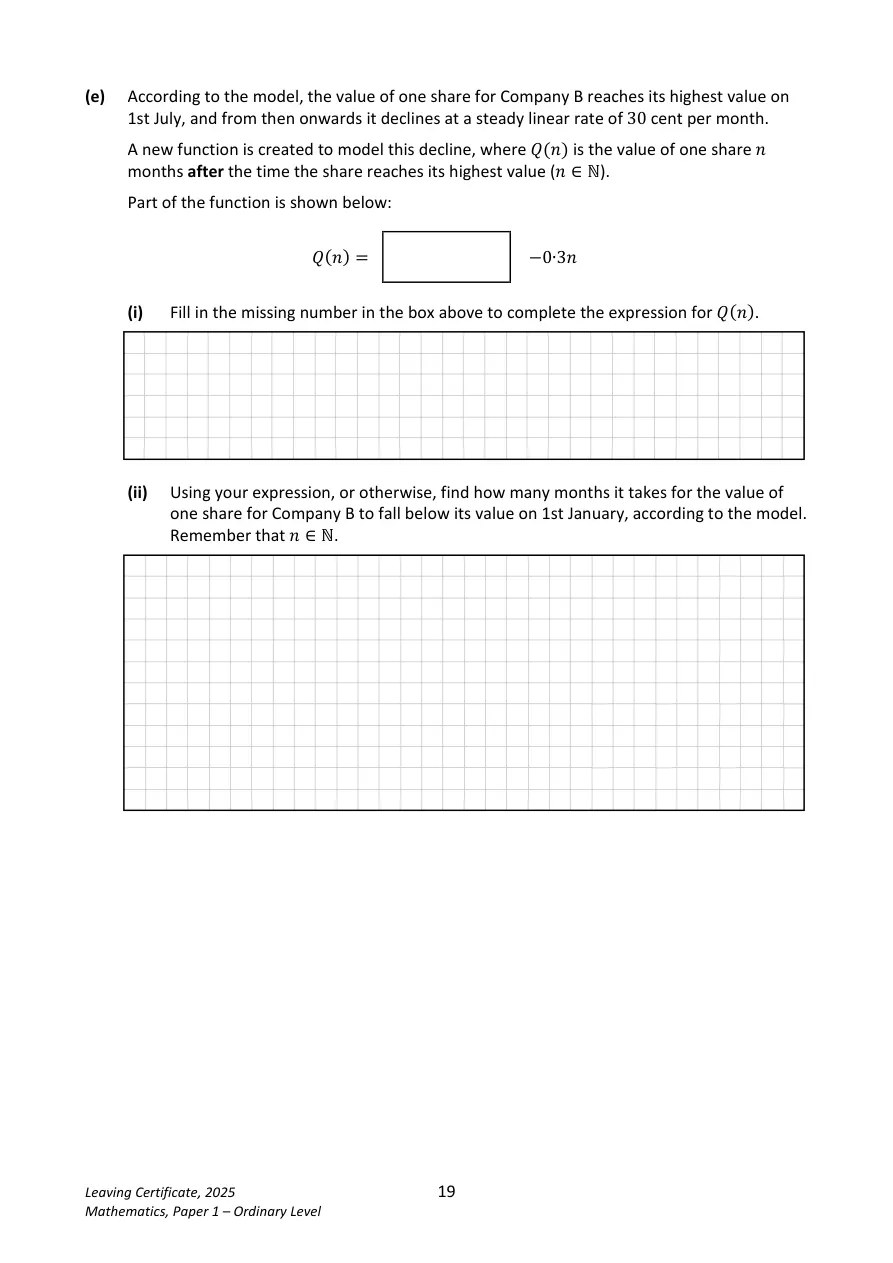
e)(i) Declining model
- Q(n)=9.22-0.3n
e)(ii) Below initial €2
- 9.22-0.3n<2
- -0.3n<-7.22
- n>\dfrac{7.22}{0.3}
- n>24.066\ldots
- n=25\ \mathrm{months}
The number of months must be a whole number and the value must be strictly below €2.
See working and diagrams on the original paper
(i) Approximately €7.30.
(ii) May: between 1 May and 1 June.
A=8(0.85)
A=\mathrm{€}6.80
Plot the August point at height 6.8 on the original graph.
\mathrm{Actual}=\dfrac{1.50}{0.163}
\mathrm{Actual}\approx\mathrm{€}9.20
Join the plotted values with a smooth increasing curve.
The curves cross during March.
Q(n)=9.22-0.3n
9.22-0.3n<2
-0.3n<-7.22
n>\dfrac{7.22}{0.3}
n>24.066\ldots
n=25\ \mathrm{months}
[The number of months must be a whole number and the value must be strictly
below €2.]Teacher sign-in and homework controls
Use your existing homework account. Questions and solutions are open to everyone.
Join a class or open your homework →