2025 · Paper 2 · Question 8 · Ordinary Level
Cars and statistical inference
Statistics · Pie charts · Correlation · Margin of error · Hypothesis tests
Mixed topics · The selected topic applies to some parts of this whole question.
Open in original paper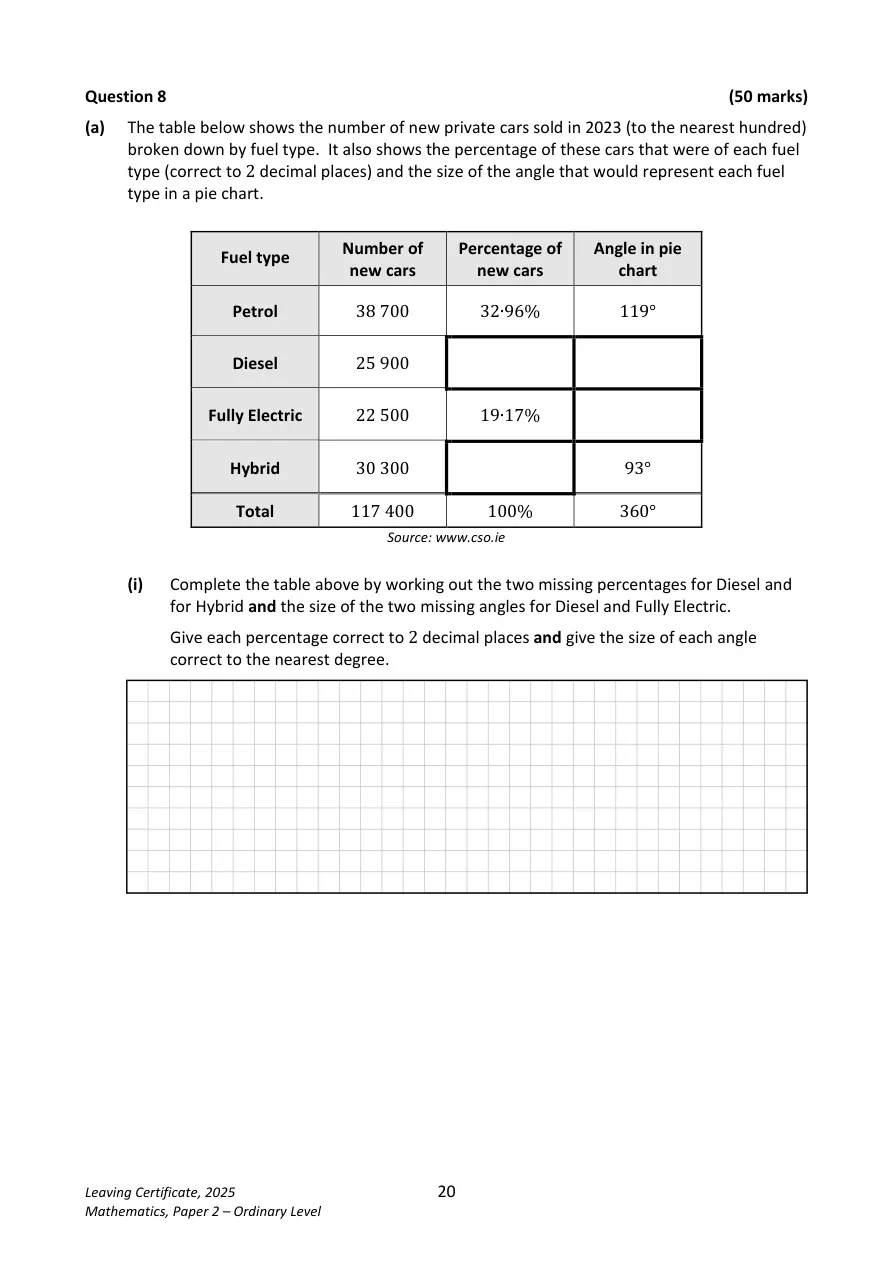
Show solutions
Follow the working below. The original question is unchanged.
a)(i) Complete table
- p_D=\dfrac{25900}{117400}\times100\approx22.06\%
- p_H=\dfrac{30300}{117400}\times100\approx25.81\%
- \theta_D=\dfrac{25900}{117400}\times360^{\circ}\approx79^{\circ}
- \theta_E=\dfrac{22500}{117400}\times360^{\circ}\approx69^{\circ}
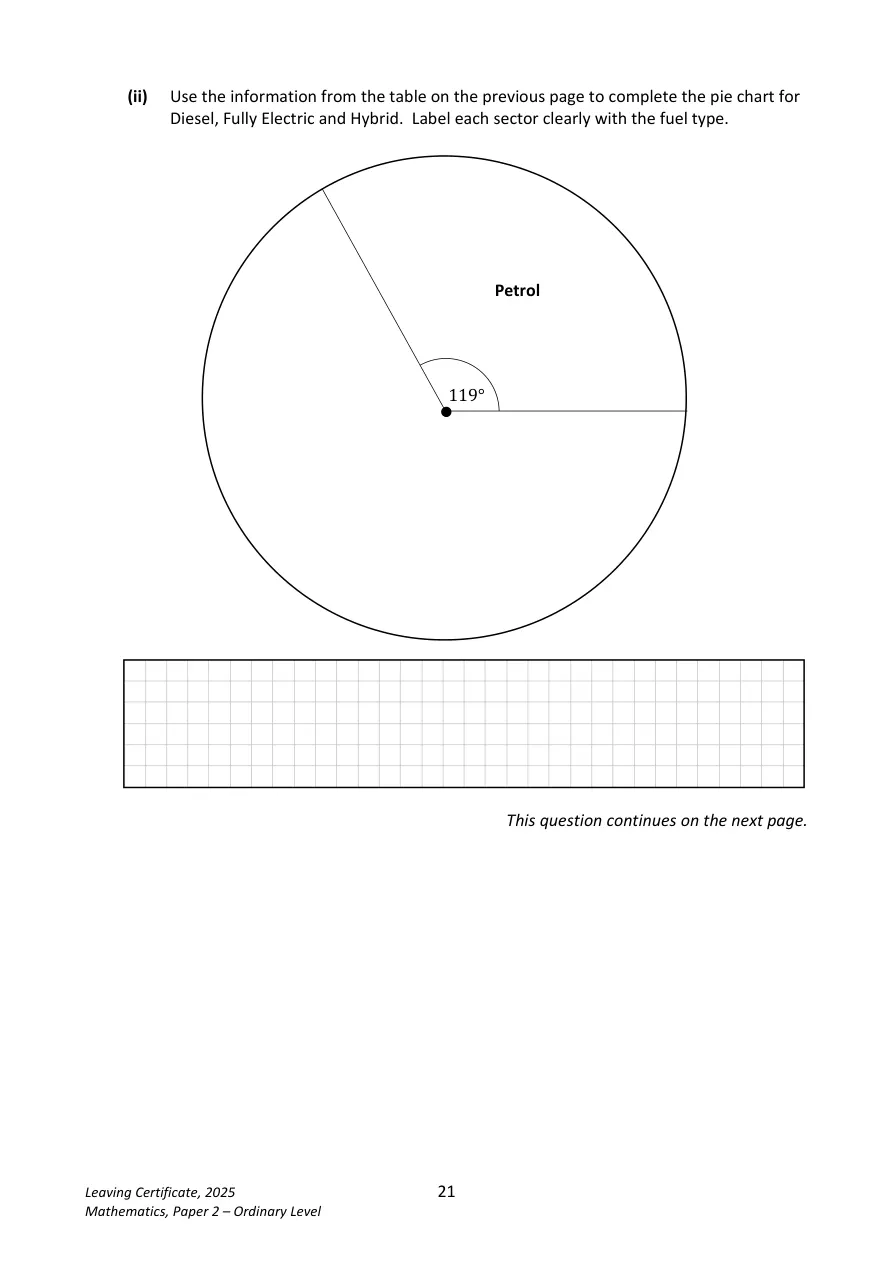
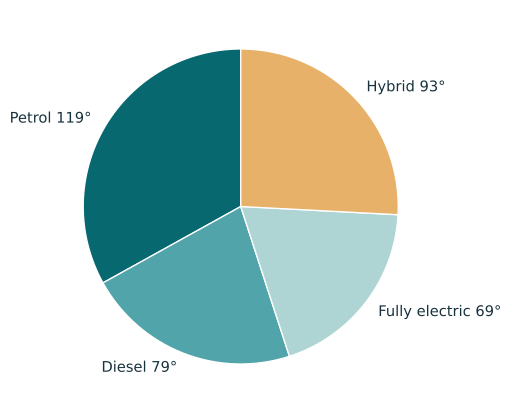
a)(ii) Pie chart
- Petrol 119°, Diesel 79°, Fully Electric 69°, Hybrid 93°. Label all sectors.
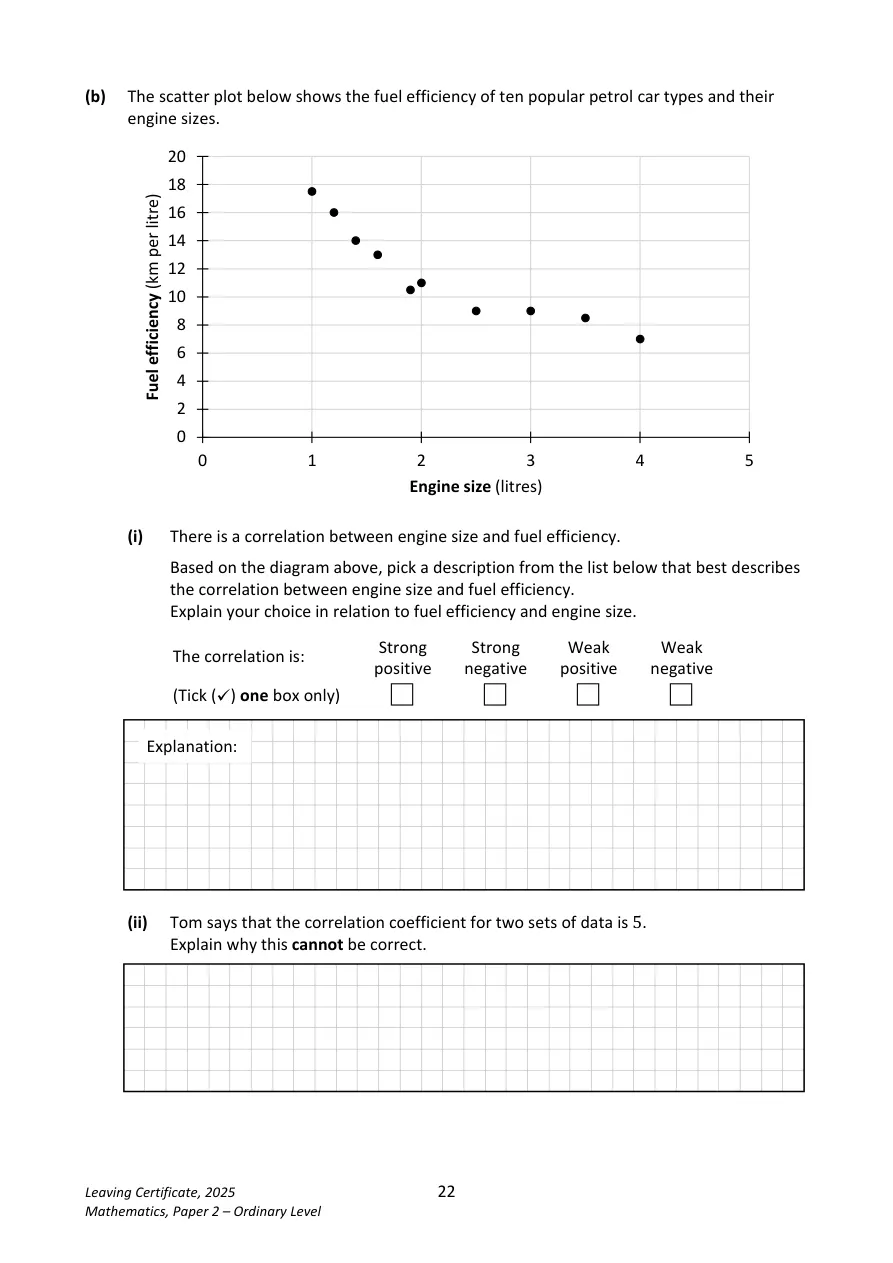
b)(i) Correlation
- Strong negative: cars with larger engines tend to travel fewer kilometres per litre. This is association, not proof of causation.
b)(ii) Correlation coefficient
- -1\leq r\leq1
- A coefficient of 5 is impossible.
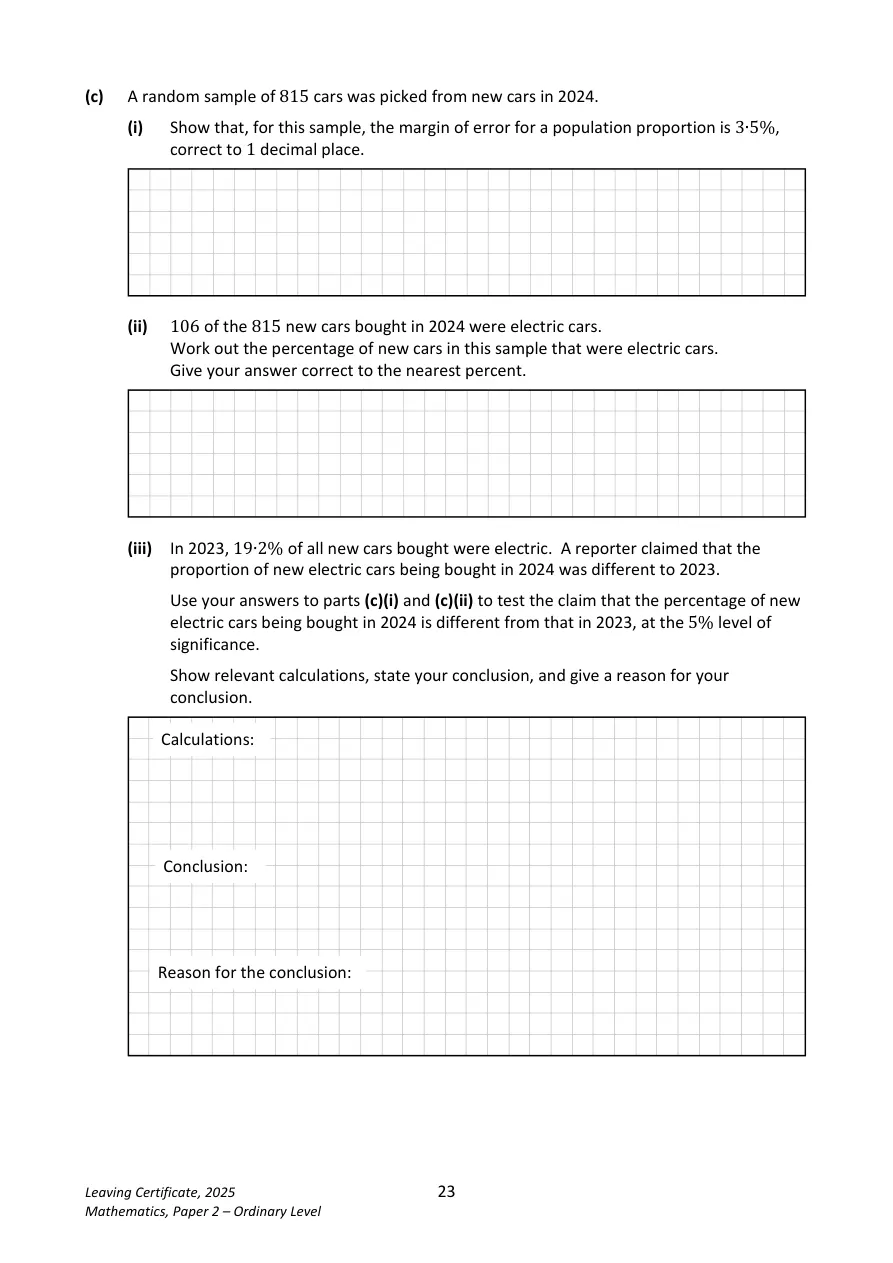
c)(i) Margin of error
- E=\dfrac{1}{\sqrt{815}}\times100\%
- E\approx3.5\%
c)(ii) Sample percentage
- \hat{p}=\dfrac{106}{815}\times100\%
- \hat{p}\approx13\%
c)(iii) Test at 5%
- CI=13\%\pm3.5\%
- CI=[9.5\%,16.5\%]
- The historical 19.2% is outside the approximate 95% interval. Reject the no-change claim: there is evidence that the population percentage changed. This does not mean every possible change is proven with certainty.
See working and diagrams on the original paper
p_D=\dfrac{25900}{117400}\times100\approx22.06\%
p_H=\dfrac{30300}{117400}\times100\approx25.81\%
\theta_D=\dfrac{25900}{117400}\times360^{\circ}\approx79^{\circ}
\theta_E=\dfrac{22500}{117400}\times360^{\circ}\approx69^{\circ}
Petrol 119°, Diesel 79°, Fully Electric 69°, Hybrid 93°. Label all sectors.
Strong negative: cars with larger engines tend to travel fewer kilometres per litre. This
is association, not proof of causation.
-1\leq r\leq1
A coefficient of 5 is impossible.
E=\dfrac{1}{\sqrt{815}}\times100\%
E\approx3.5\%
\hat{p}=\dfrac{106}{815}\times100\%
\hat{p}\approx13\%
CI=13\%\pm3.5\%
CI=[9.5\%,16.5\%]
The historical 19.2% is outside the approximate 95% interval. Reject the no-change
claim: there is evidence that the population percentage changed. This does not mean
every possible change is proven with certainty.
Teacher sign-in and homework controls
Use your existing homework account. Questions and solutions are open to everyone.
Join a class or open your homework →