2023 · Question 2 · Higher Level
Sales and returns graphs
Statistics · Graphs · Percentages
Mixed topics · The selected topic applies to some parts of this whole question.
Open in original paper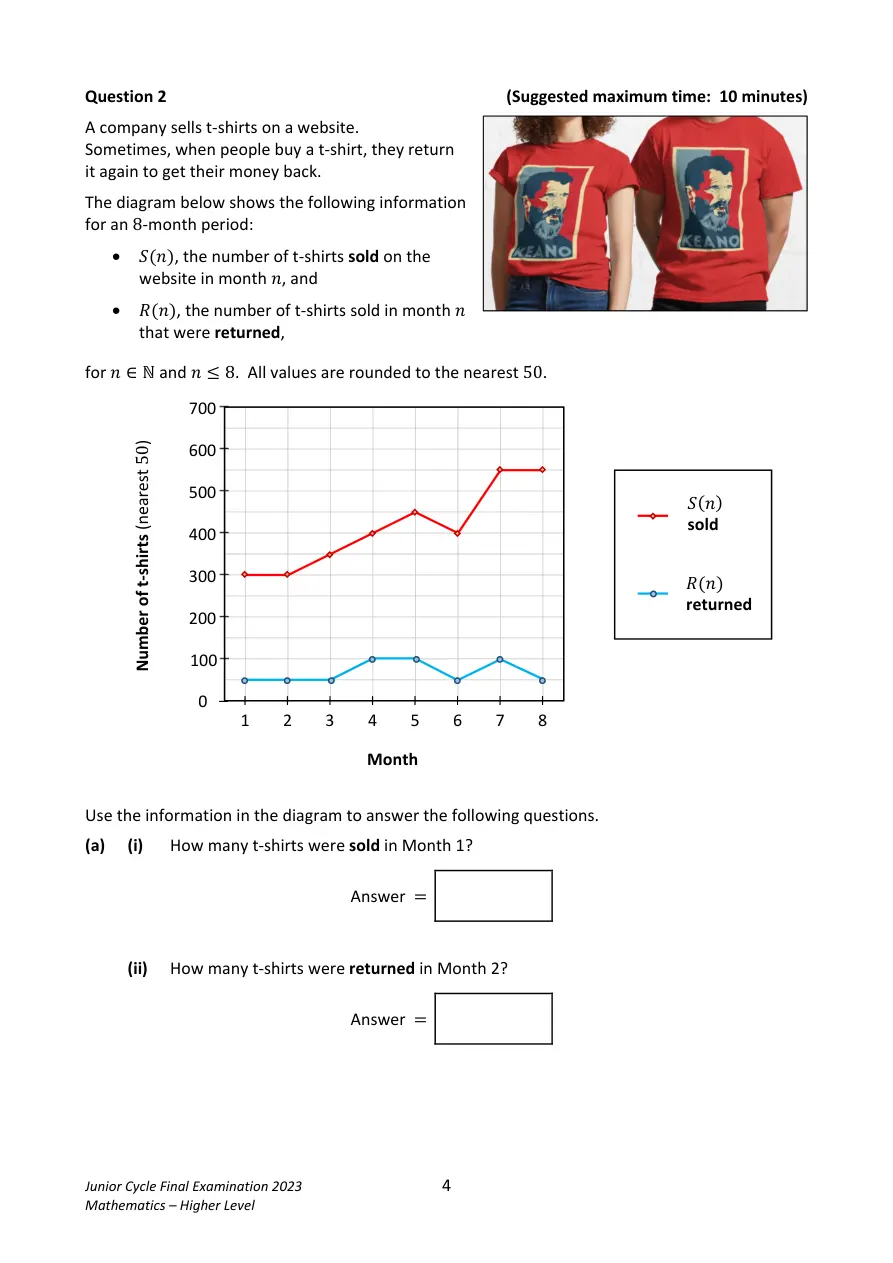
Show solutions
Follow the working below. The original question is unchanged.
a) Read the graph
- S(1)=300
- R(2)=50
b) Greatest increase
- Month 7 has the largest increase in sales compared with the preceding month.
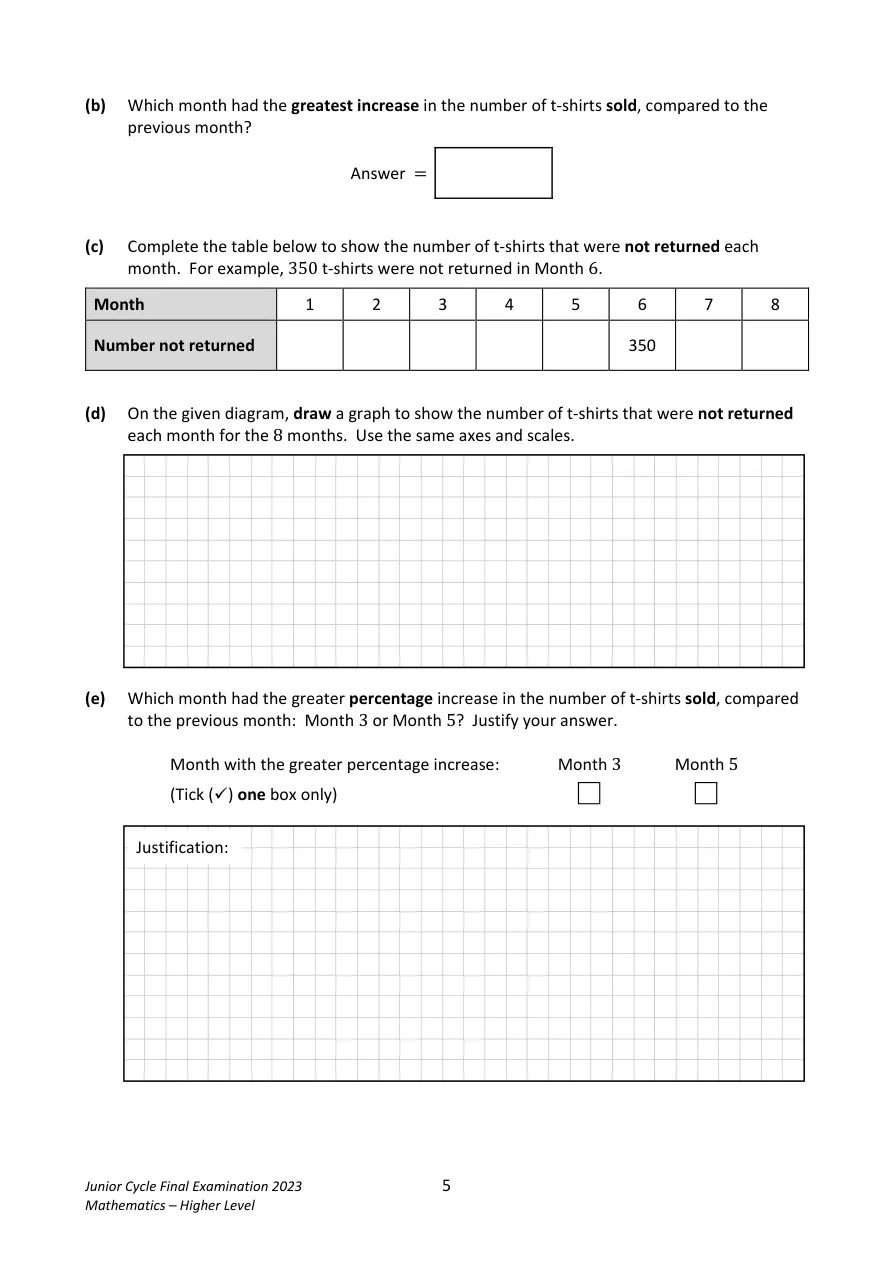
c) Not returned
- N(n)=S(n)-R(n)
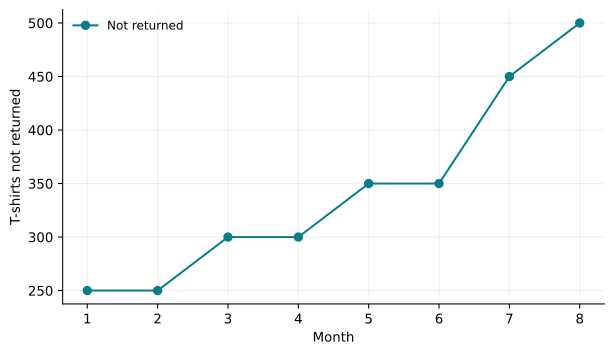
- Months 1 to 8: 250, 250, 300, 300, 350, 350, 450, 500.
d) Draw the graph
- Plot those eight values at their corresponding months and join consecutive points on the given axes. See the solution graph.
e) Compare percentage increases
- \%_3=\dfrac{350-300}{300}\times100
- \%_3\approx16.67\%
- \%_5=\dfrac{450-400}{400}\times100
- \%_5=12.5\%
- Month 3 has the greater percentage increase. Both rises are 50, but Month 3 starts from the smaller base.
See working and diagrams on the original paper
300
50
\%_3=\dfrac{350-300}{300}\times100
[Divide by the previous month’s sales.]\%_3\approx16.67\%
\%_5=\dfrac{450-400}{400}\times100
\%_5=12.5\%
Month 3 has the greater percentage increase. Both rises are 50, but Month 3 starts
from the smaller base.
Month 7
Teacher sign-in and homework controls
Questions and worked solutions are open to everyone. Use your homework account for teacher controls.
Join a class or open your homework →