2023 · Question 4 · Higher Level
Creche statistics
Statistics · Histograms · Mean · Percentages
Mixed topics · The selected topic applies to some parts of this whole question.
Open in original paper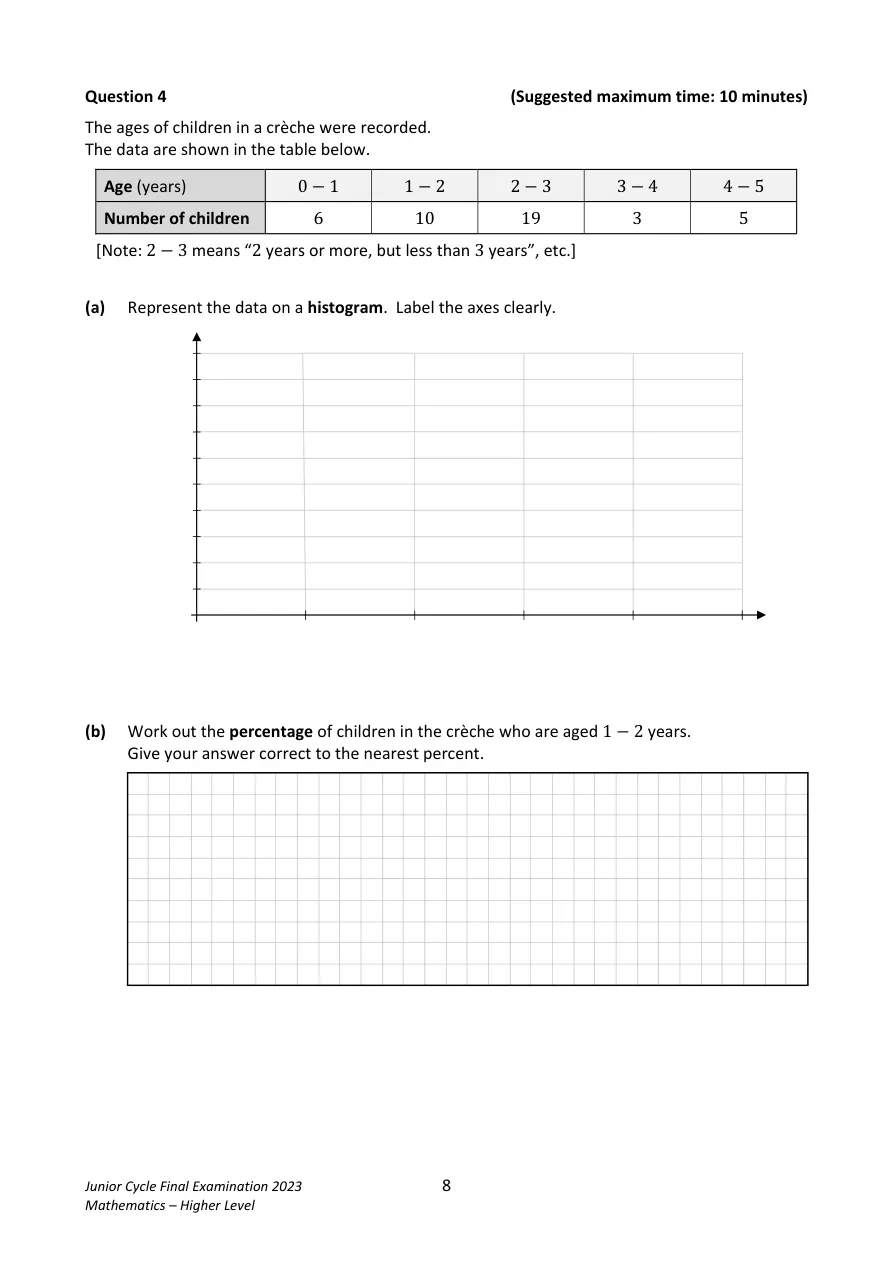
Show solutions
Follow the working below. The original question is unchanged.
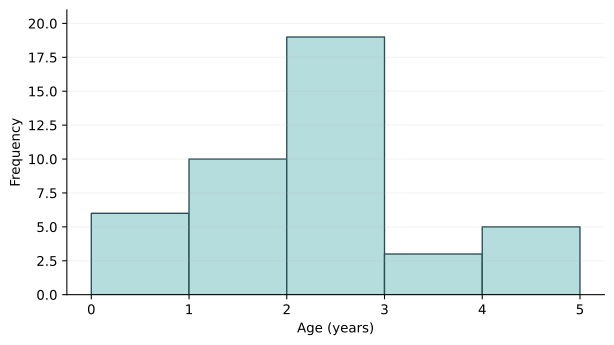
a) Histogram
- Draw touching bars on age intervals 0–1, 1–2, 2–3, 3–4 and 4–5 years, with heights 6, 10, 19, 3 and 5. Label horizontal axis Age (years), vertical axis Number of children.
b) Percentage aged 1–2
- N=6+10+19+3+5=43
- p=\dfrac{10}{43}\times100
- p\approx23\%
c) Estimated mean
- \bar{x}=\dfrac{6(0.5)+10(1.5)+19(2.5)+3(3.5)+5(4.5)}{43}
- \bar{x}=\dfrac{98.5}{43}
- \bar{x}\approx2.3\ \mathrm{years}
Midpoints give an estimate, not the exact mean.
d) Staff needed
- n_{0-1}=\dfrac{6}{3}=2
- n_{1-2}=\dfrac{10}{5}=2
- n_{2-3}=\left\lceil\dfrac{19}{6}\right\rceil=4
Round up: three staff can mind only 18 in this band.
- n_{3-6}=\dfrac{3+5}{8}=1
- n=2+2+4+1=9\ \mathrm{staff}
See working and diagrams on the original paper
N=6+10+19+3+5=43
p=\dfrac{10}{43}\times100
p\approx23\%
\bar{x}=\dfrac{6(0.5)+10(1.5)+19(2.5)+3(3.5)+5(4.5)}{43}
[Use each class midpoint as its representative age.]\bar{x}=\dfrac{98.5}{43}
\bar{x}\approx2.3\ \mathrm{years}
n_{0-1}=\dfrac{6}{3}=2
n_{1-2}=\dfrac{10}{5}=2
n_{2-3}=\left\lceil\dfrac{19}{6}\right\rceil=4
[Round up: three staff can mind only 18 in this band.]n_{3-6}=\dfrac{3+5}{8}=1
n=2+2+4+1=9\ \mathrm{staff}
Teacher sign-in and homework controls
Questions and worked solutions are open to everyone. Use your homework account for teacher controls.
Join a class or open your homework →