2024 · Question 2 · Higher Level
Long jump statistics
Statistics · Histograms · Mean · Median
Mixed topics · The selected topic applies to some parts of this whole question.
Open in original paper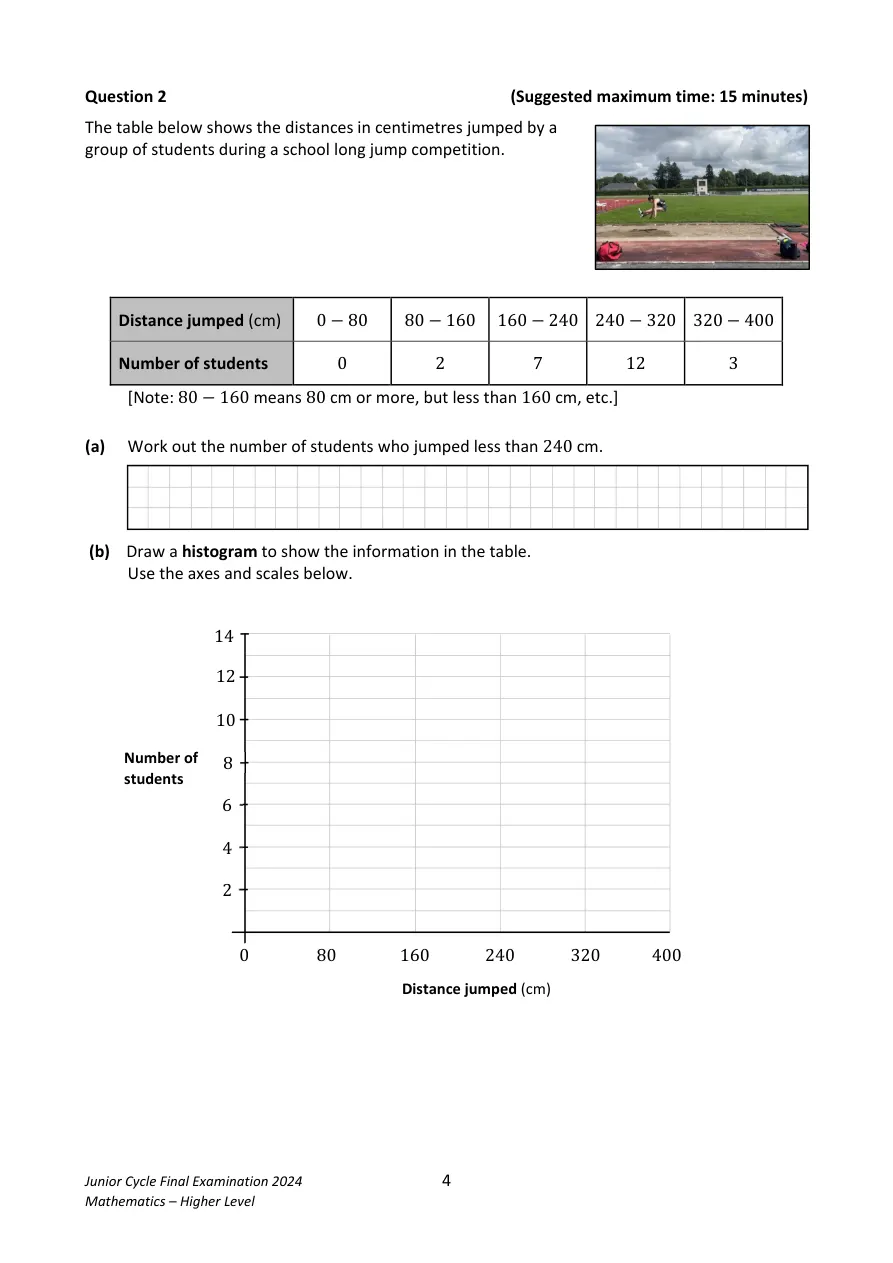
Show solutions
Follow the working below. The original question is unchanged.
a) Below 240 cm
- 0+2+7=9\ \mathrm{students}
b) Histogram
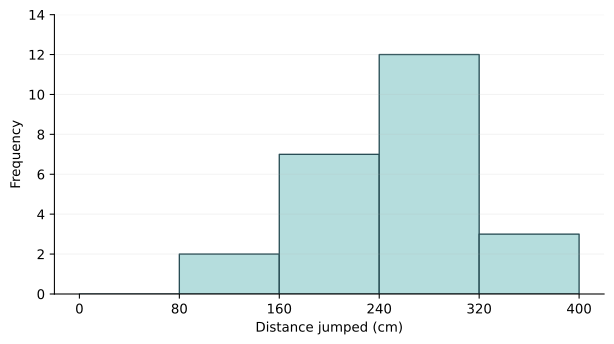
- Touching bars on intervals 0–80, 80–160, 160–240, 240–320, 320–400 cm have heights 0, 2, 7, 12, 3. The intervals have equal widths.
c) Maximum above 200 cm
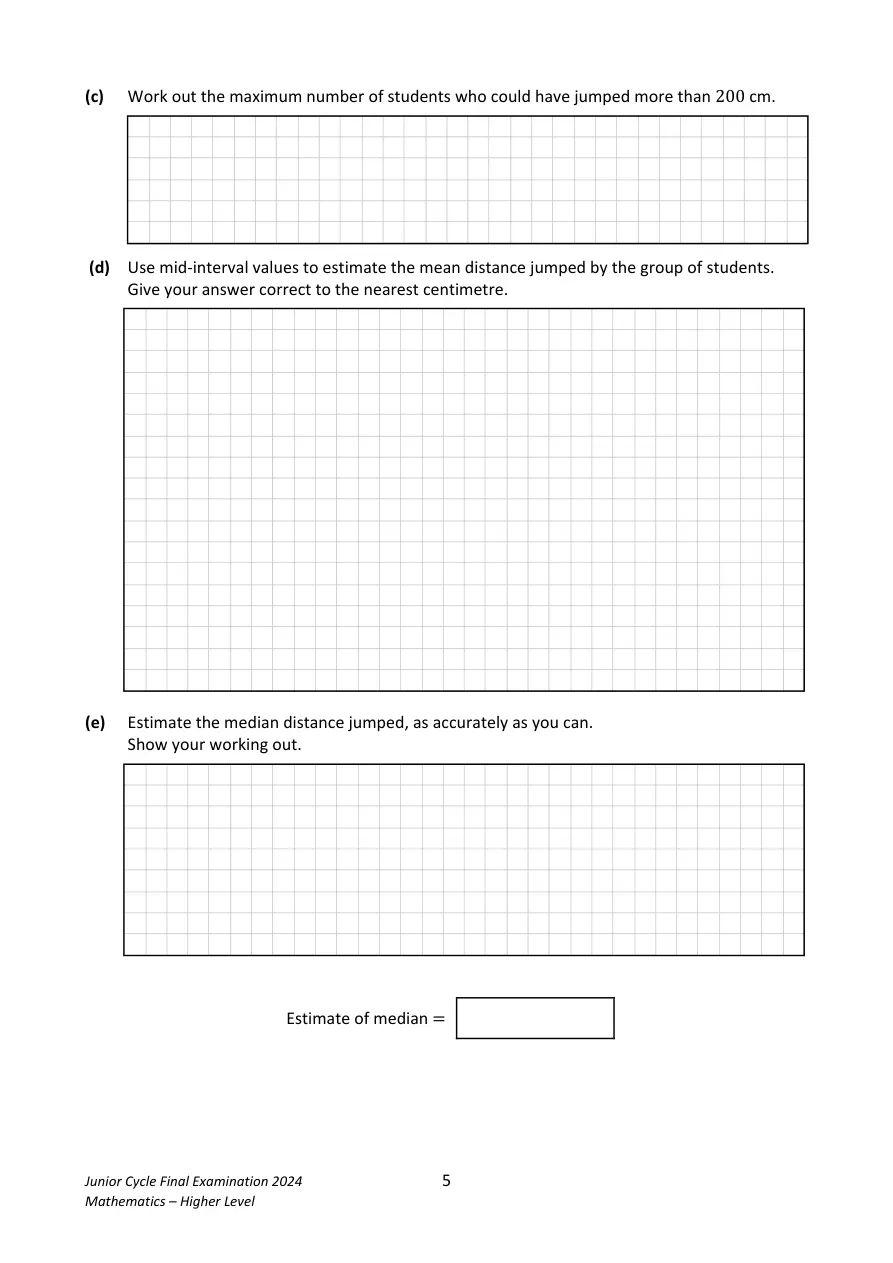
- 7+12+3=22
All seven in the 160–240 interval could be above 200 cm.
d) Estimated mean
- \bar{x}=\dfrac{0(40)+2(120)+7(200)+12(280)+3(360)}{24}
- \bar{x}=\dfrac{6080}{24}
- \bar{x}\approx253\ \mathrm{cm}
e) Estimated median
- N=24
- \mathrm{Median\ class}=240\text{–}320\ \mathrm{cm}
There are 9 students before this class; the middle observations are the 12th and 13th.
- M\approx240+\dfrac{12-9}{12}(80)
Linear interpolation assumes values spread uniformly in the class.
- M\approx260\ \mathrm{cm}
- The grouped data cannot give an exact median. The SEC model gives approximately 260 cm; an explicitly stated interpolation convention can give a nearby estimate.
See working and diagrams on the original paper
0+2+7=9\ \mathrm{students}
7+12+3=22
[All seven in the 160–240 interval could be above 200 cm.]\bar{x}=\dfrac{0(40)+2(120)+7(200)+12(280)+3(360)}{24}
[Use each class midpoint.]\bar{x}=\dfrac{6080}{24}
\bar{x}\approx253\ \mathrm{cm}
N=24
\mathrm{Median\ class}=240\text{–}320\ \mathrm{cm}
M\approx240+\dfrac{12-9}{12}(80)
[Interpolate within the median class.]M\approx260\ \mathrm{cm}
The grouped data cannot give an exact median. The SEC model gives approximately 260 cm; an explicitly
stated interpolation convention can give a nearby estimate.
260
Teacher sign-in and homework controls
Questions and worked solutions are open to everyone. Use your homework account for teacher controls.
Join a class or open your homework →