2026 · Question 2 · Higher Level
Phone usage statistics
Statistics · Histograms · Mean · Pie charts
Mixed topics · The selected topic applies to some parts of this whole question.
Open in original paper
Show solutions
Follow the working below. The original question is unchanged. These 2026 maths answers are independent teacher solutions; an SEC marking scheme has not been obtained.
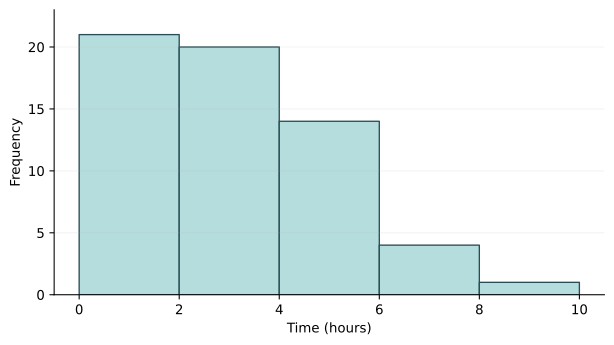
a)(i) Histogram
- Draw touching bars for 0–2, 2–4, 4–6, 6–8, 8–10 hours, with heights 21, 20, 14, 4 and 1. Label axes and retain the given scale.
a)(ii) Maximum below 3 hours
- N=21+20
- N=41
All twenty in the 2–4 band could fall below 3 hours.
a)(iii) Estimated mean
- \bar{x}=\dfrac{21(1)+20(3)+14(5)+4(7)+1(9)}{60}
- \bar{x}=\dfrac{188}{60}
- \bar{x}\approx3.1\ \mathrm{h}
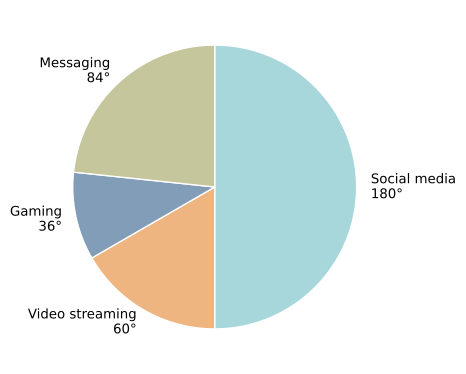
b) Pie chart
- \theta=\dfrac{f}{60}\times360^{\circ}
- \theta_{\mathrm{social}}=180^{\circ}
- \theta_{\mathrm{video}}=60^{\circ}
- \theta_{\mathrm{gaming}}=36^{\circ}
- \theta_{\mathrm{messaging}}=84^{\circ}
- 180+60+36+84=360
Check that the sectors fill one circle.
See working and diagrams on the original paper
N=21+20
N=41
[All twenty in the 2–4 band could fall below 3 hours.]\bar{x}=\dfrac{21(1)+20(3)+14(5)+4(7)+1(9)}{60}
[Use class midpoints.]\bar{x}=\dfrac{188}{60}
\bar{x}\approx3.1\ \mathrm{h}
\theta=\dfrac{f}{60}\times360^{\circ}
\theta_{\mathrm{social}}=180^{\circ}
\theta_{\mathrm{video}}=60^{\circ}
\theta_{\mathrm{gaming}}=36^{\circ}
\theta_{\mathrm{messaging}}=84^{\circ}
180+60+36+84=360
[Check that the
sectors fill one
circle.]Teacher sign-in and homework controls
Questions and worked solutions are open to everyone. Use your homework account for teacher controls.
Join a class or open your homework →